What do we do?
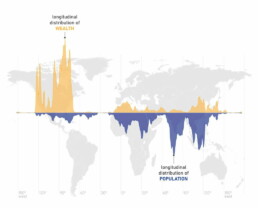
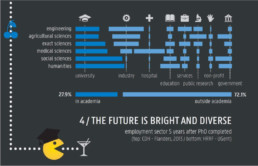
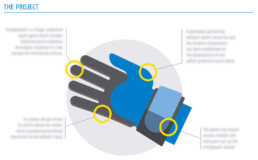
Information graphics, often shortened to ‘infographics’, are an excellent tool to present your complex information in a visually attractive, but correct and accurate way. They combine well-chosen data visualizations with a small amount of text and a handful of clarifying icons and illustrations.
At Baryon, we can help you do exactly that. We are experts in many different infographic approaches.

Why infographics?
If you have a lot of data or complex information and you wish to communicate effectively to either a wide or a very specific audience, an infographic or custom data visualization is the perfect choice. Visual communication helps you to attract more attention, boost interaction with your audience, and get your message across faster.
"People remember only 10% of what they hear, 20% of what they read, but 80% of what they SEE."
Different goals, different flavours
Infographics come in any shape or size. They can be created specifically for print in newspapers or magazines, or as a beautiful wall decoration to awe and inspire your guests. Or they can be designed for online use on your website or social media. Online infographics can be static, dynamic, or even completely interactive allowing users to explore the data and information themselves. Pick your favourite flavour!

What we can do for you:

Static infographics
Static infographics are perfect for both print and online applications. This can range from a set of small visuals for use on social media to large beautifully crafted posters to decorate your office walls.
Pricing: typically starting at € 1000

Dynamic infographics
Add some spicing to your infographics by introducing animated graphs, maps or illustrations. Guide your audience through a captivating visual story or publish an intriguing visual essay. Use the power of visual storytelling to your full advantage!
Pricing: typically starting at € 2000

Interactive infographics
The ultimate infographic: get maximal engagement from your audience by providing them with interactive options, letting them explore maps and data visualizations to experience your content at their own fingertips.
Pricing: contact us for a custom offer
Eager to turn your complex data into powerful and attractive information graphics?

