What do we do?
You have a lot of interesting data to share, but unfortunately it comes in the form of boring Excel spreadsheets. Or you are working on a complicated, highly technical or scientific topic, and you are experiencing difficulties explaining it clearly to your audience. Or maybe your startup is building a world-class new app, which deserves a world-class user experience.
No matter what your information design challenge is, we are here to help.
Make it visual
Untangling the Gordian knot of complex information requires a combination of analytical, creative, and communication skills.
Our team has a diverse background in engineering, research, business, innovation and design. We will analyze your issues, ask the right questions and find solutions to turn your information into a visual masterpiece.
What we can do for you

Dashboard analysis and design
(re)designing dashboards, ensuring that the right information is presented clearly at the right time.
Optimizing the user experience through layout, color and typography, and interactivity choices.

Report design
(re)designing online and offline reports, make them easier to read and more enjoyable to look at.
Matching clever copywriting with clear data visualisation to effectively communicate your findings.

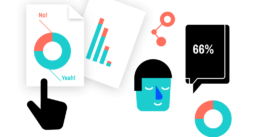
Infographics
Combining illustrations, charts and text to turn your message in a visual masterpiece.
Read all about it on our dedicated infographics page.

Visual storytelling
Turning your blog posts or articles into highly visual, actionable stories.
Spice up your text with interactive charts, maps, video and animation.
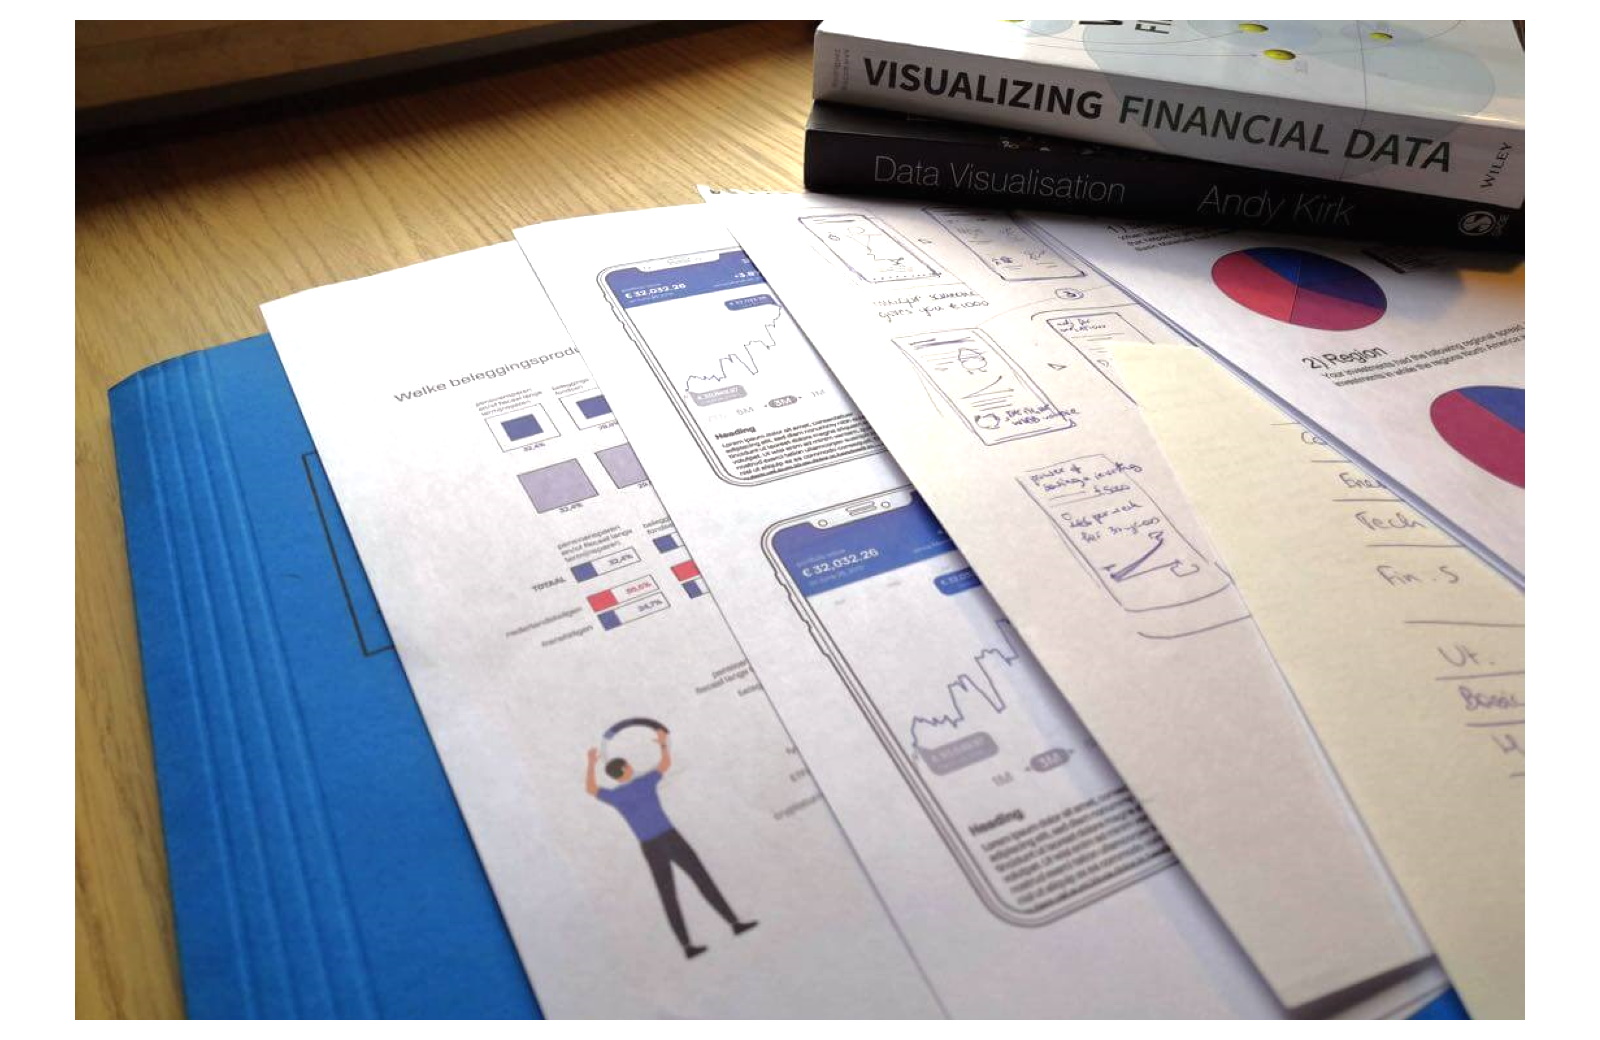
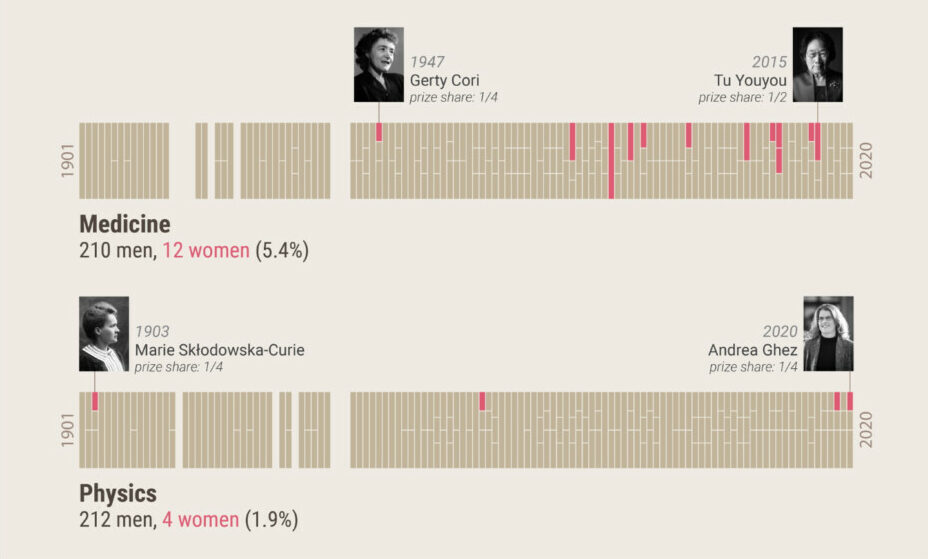
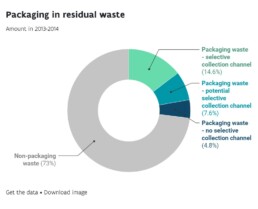
Some of our work
Let’s make your data visual!
If you’re ready to turn your own complex data into powerful visuals, don’t hesitate to contact us. We are here to help!
Or book a free 60-minute strategy session to get you on the right track.
Eager to turn your complex data into powerful and attractive information graphics?