Tell me why... I don't like dashboards
😶 I don’t like dashboards. There, I said it.
Ok, some nuance: I don’t like _most_ dashboards. The main reason: they’re trying to do everything, everywhere, all at once.
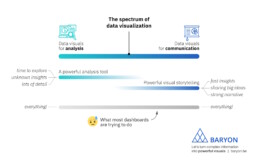
On the spectrum of data visualization, two main clusters of powerful visuals exist:
1️⃣ Data visuals for analysis: useful for data analysts, who have time to explore the data in full detail, with lots of filters, offering many different perspectives on the data. Their goal: extracting the insights from the data.
2️⃣ Data visuals for communication: useful for managers, or a more general audience. They don’t have a lot of time and want to know the major insights, fast, loud and clear. For more complicated stuff, we can craft a strong narrative to guide them through the major insights.
What most dashboards are trying to do, is both of these things simultaneously: raw data goes in, crystal-clear insights come out – or so people expect.
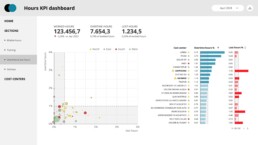
The solution? We make a full-fledged dashboard for the analysts, and a dedicated light-weight version for the management, showing only what they need to know for their decision-making. Or we do our analysis first, and translate those insights into an engaging visual storytelling piece, or an attractive visual report.
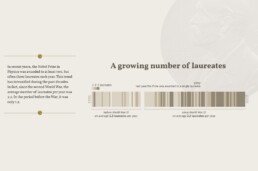
As always, we have to think about the audience and their goals. Not just dump the data on top of them, and hope they will figure it out!
Read more:
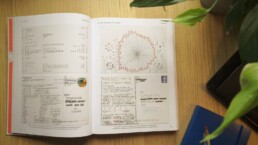
Dear Data: Dataviz book review
Last February, on a cold and rainy day, I received the Dear Data book as part of a Dataviz Drawing workshop by Stefanie Posavec. A pretty large and heavy book, the kind you could put on your coffee table to show off (which I did!). Let's review it!
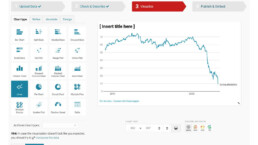
Data visualization tools: Datawrapper
If you are writing articles online and need to quickly insert beautiful, interactive charts, maps or tables, Datawrapper is the tool you are looking for.
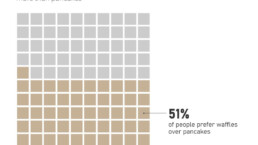
Uncommon chart types: Waffle charts
If you thought a pie chart was the only food-related chart type out there, think again! Waffle charts are a great alternative.

We are really into visual communication!
Every now and then we send out a newsletter with latest work, handpicked inspirational infographics, must-read blog posts, upcoming dates for workshops and presentations, and links to useful tools and tips. Leave your email address here and we’ll add you to our mailing list of awesome people!