Projects
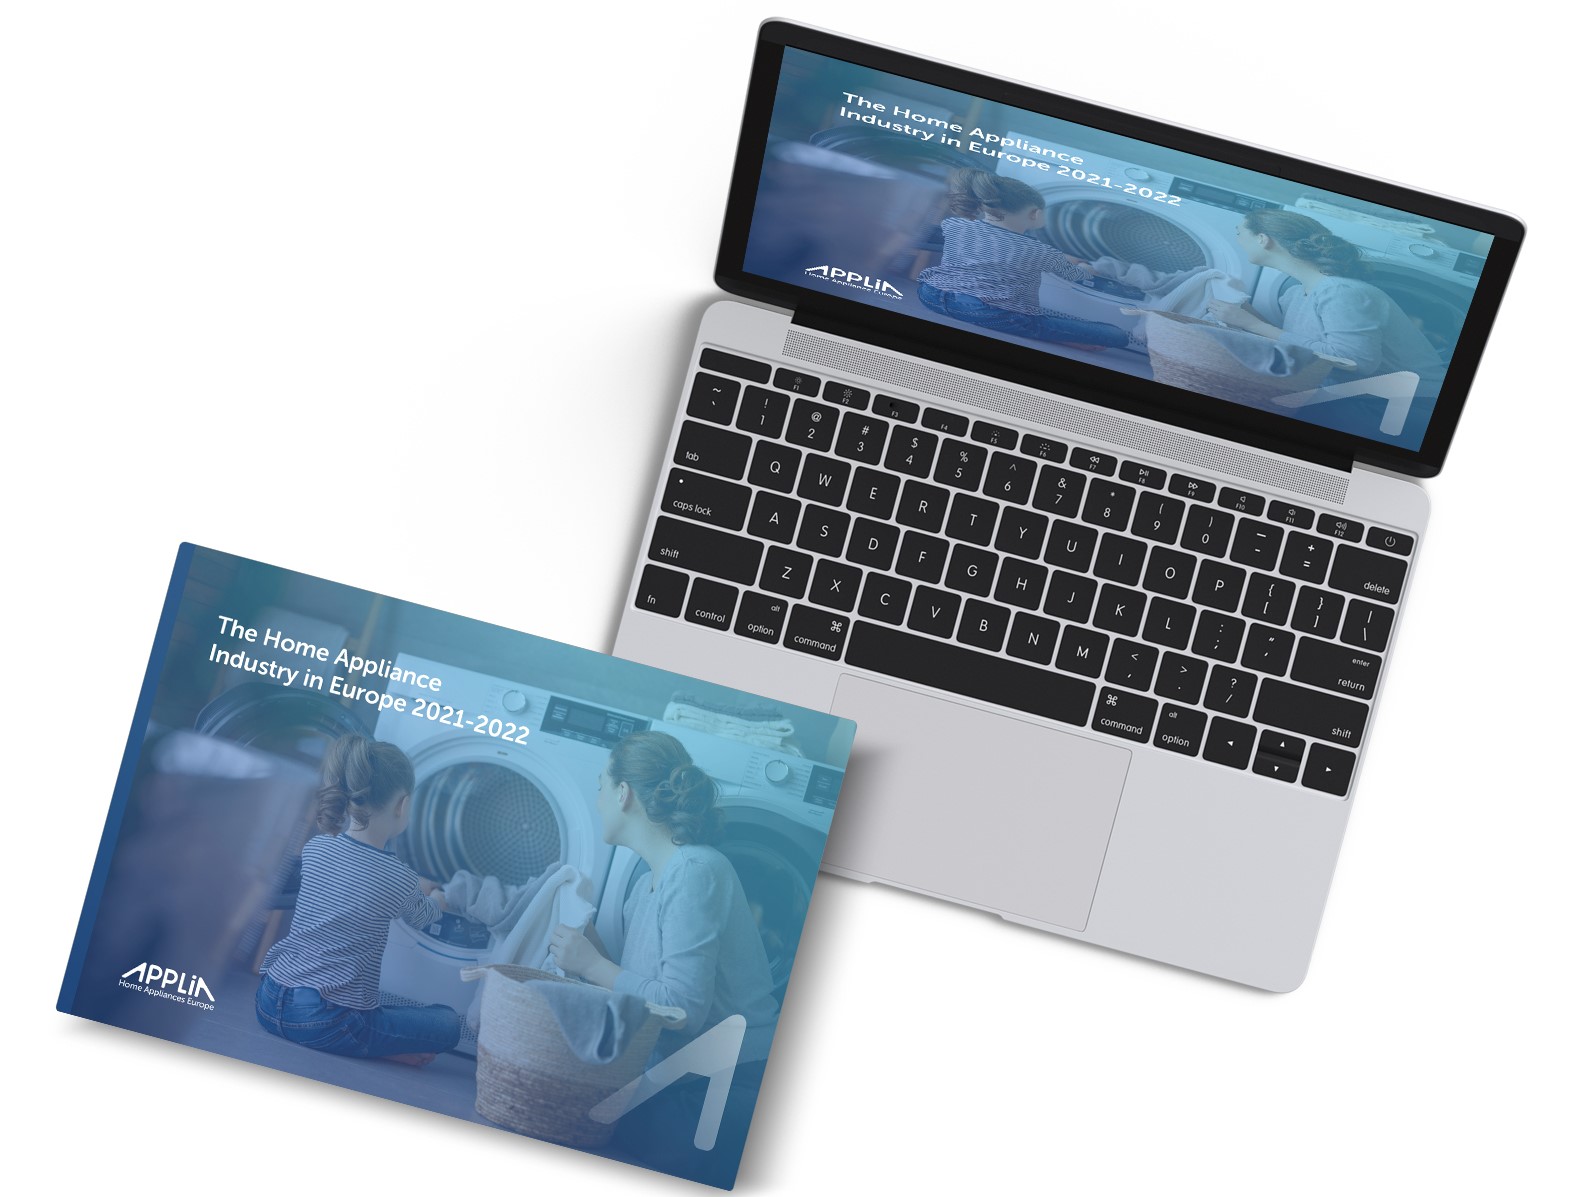
APPLiA Statistical report
The home appliance industry in Europe at a glance
Every year, APPLiA - the European industry association for the home appliance sector -
publishes a statistical report showcasing the impact of the sector on our economy and our
daily lives.
Data visualizationInfographicsReport design
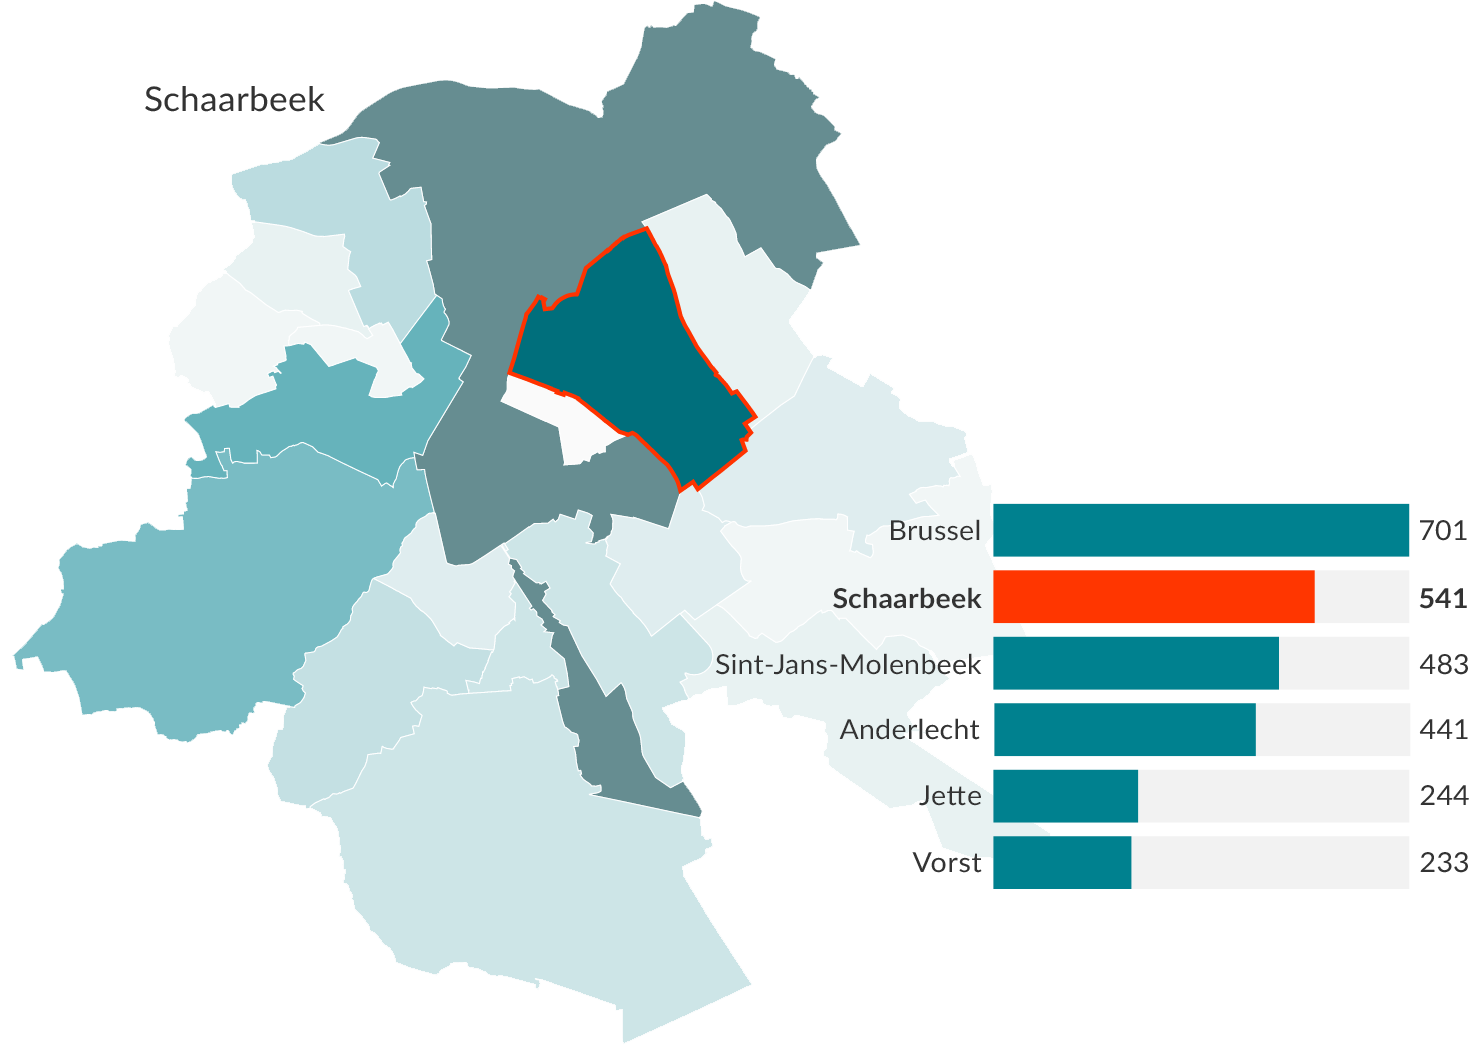
BXL.Kinderopvang
Mapping childcare in Brussels
We transformed a 130-page report into an interactive, structured and accessible dashboard
for the general public spanning 3 categories, 39 parameters, 5 chart types and 2 map
levels.
Data visualizationMapsDashboard design
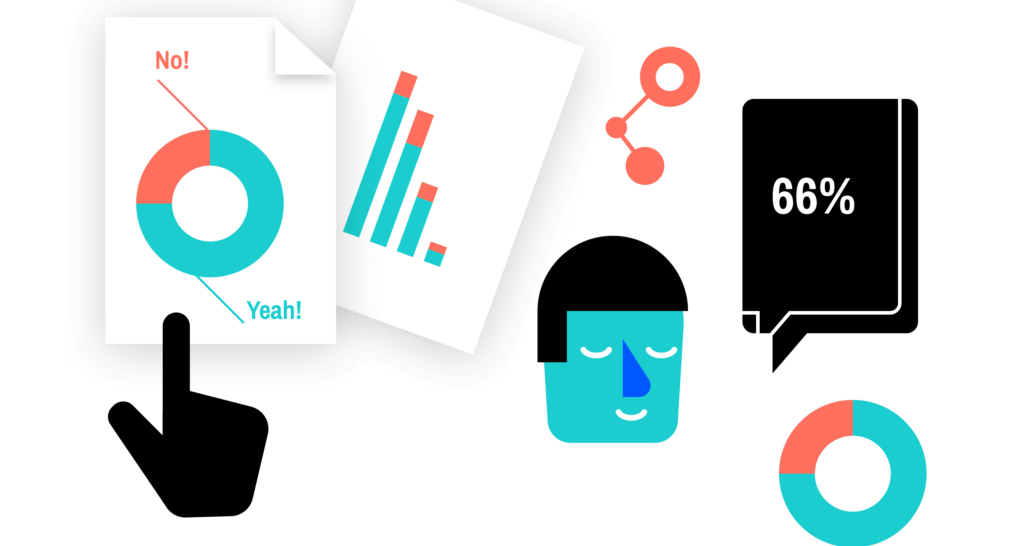
CE monitor
Visualizing the status of our circular economy
A bilingual website built around interactive charts on 116 different topics, a great
example of accessible and open data communication by the government.
Data visualizationInformation design
-2-edit-png-24.74080d4b.png)
Baryon Design
The vehicles of James Bond
2022 marked the 60th anniversary of the first James Bond movie, Dr.No. To celebrate this
seminal moment in cinema we created a mobile-first interactive infographic and a companion
poster showing all of the vehicles this famous spy ever used.
Data visualizationVisual storytellingInfographics
Eager to turn your complex data into powerful and attractive information graphics?