Infographic
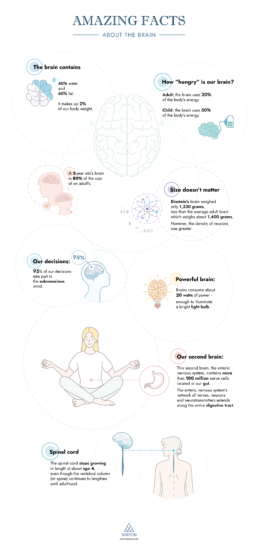
Amazing facts about the brain
🧠 Did you know that our brain makes up 2% of our body weight, but consumes as much as 20% of our energy? Did you know that we have a second brain, located in our gut?
Our information designer Sofia is very passionate about our brain and how it works. She made this insightful brain infographic, giving you an overview of eight amazing facts about the brain!
If you’re looking for your own infographic to share a fascinating story with your audience, we’re here to help! Find out what we can do for you.
Read more:

Research visuals: all the resources you’ll ever need!
If you want to start creating clear and attractive visuals about your research, but don't know where to start, this page is for you! Here's a complete overview of tools, resources and inspiration you can use as a starting point for your designs.

Small datasets to practice your data visualization skills
When you're teaching data analysis or data visualization, or when you're learning new data visualization tools and techniques, you might be looking for datasets to practice with. Here are some great starting points.

How to create a graphical abstract
Graphical abstracts are becoming more and more important. Journal publishers such as Elsevier encourage you to create a concise visual summary of the main findings of your research. But where to start? What steps should you follow to create the perfect graphical abstract for your article? What tools can you use?

Behind the maps
In the 30-day Map Challenge, you are challenged to design a new map every day around a certain topic. I participated in November 2020, and wrote this post to share my thought processes, data sources, tools and results!
Data visualization resources: all the links you’ll ever need!
You want to start creating clear and attractive data visuals, but don't know where to start? No worries, here's a complete overview of tools, resources and inspiration you can use as a starting point for your designs.
Storytelling with Data: Dataviz book review
The Storytelling with Data book has been on my wishlist as long as I can remember, because so many people recommend it as one of the must read dataviz books. So let's see what the fuzz is all about - here's my review!
We are really into visual communication!
Every now and then we send out a newsletter with latest work, handpicked inspirational infographics, must-read blog posts, upcoming dates for workshops and presentations, and links to useful tools and tips. Leave your email address here and we’ll add you to our mailing list of awesome people!

