Data visualization podcasts for 2023
At Baryon, we’re huge fans of podcasts! Data visualization podcasts are a great way to stay up to date on the latest trends and techniques in data visualization. They provide valuable insights into various topics like data visualization design, visual communication, data exploration, and more. Listening to podcasts can also provide inspiration for your own data visualization projects. Finally, podcasts are a great way to learn from experienced professionals in the field, as well as stay connected to the data visualization community. They often present interviews with the most famous people in the field.
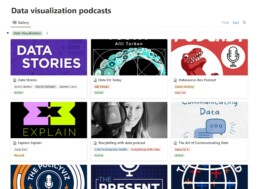
Popular data visualization podcasts include Data Stories, Storytelling with Data and Data Viz Today, but there are many more!
We’ve compiled a list of our favourite podcasts about data visualization (and data science in general) on Notion. This updated list shows the data visualization podcasts you should give a try in 2023. Use the button below to find information on all of them, including links to Spotify, Apple Podcasts and Google Podcasts!
Read more:

Research visuals: all the resources you’ll ever need!
If you want to start creating clear and attractive visuals about your research, but don't know where to start, this page is for you! Here's a complete overview of tools, resources and inspiration you can use as a starting point for your designs.

Small datasets to practice your data visualization skills
When you're teaching data analysis or data visualization, or when you're learning new data visualization tools and techniques, you might be looking for datasets to practice with. Here are some great starting points.

How to create a graphical abstract
Graphical abstracts are becoming more and more important. Journal publishers such as Elsevier encourage you to create a concise visual summary of the main findings of your research. But where to start? What steps should you follow to create the perfect graphical abstract for your article? What tools can you use?

Behind the maps
In the 30-day Map Challenge, you are challenged to design a new map every day around a certain topic. I participated in November 2020, and wrote this post to share my thought processes, data sources, tools and results!
Data visualization resources: all the links you’ll ever need!
You want to start creating clear and attractive data visuals, but don't know where to start? No worries, here's a complete overview of tools, resources and inspiration you can use as a starting point for your designs.
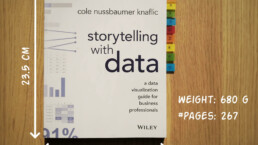
Storytelling with Data: Dataviz book review
The Storytelling with Data book has been on my wishlist as long as I can remember, because so many people recommend it as one of the must read dataviz books. So let's see what the fuzz is all about - here's my review!
We are really into visual communication!
Every now and then we send out a newsletter with latest work, handpicked inspirational infographics, must-read blog posts, upcoming dates for workshops and presentations, and links to useful tools and tips. Leave your email address here and we’ll add you to our mailing list of awesome people!

