This chart is trying to trick you
⚠ Warning: this chart is lying to you!
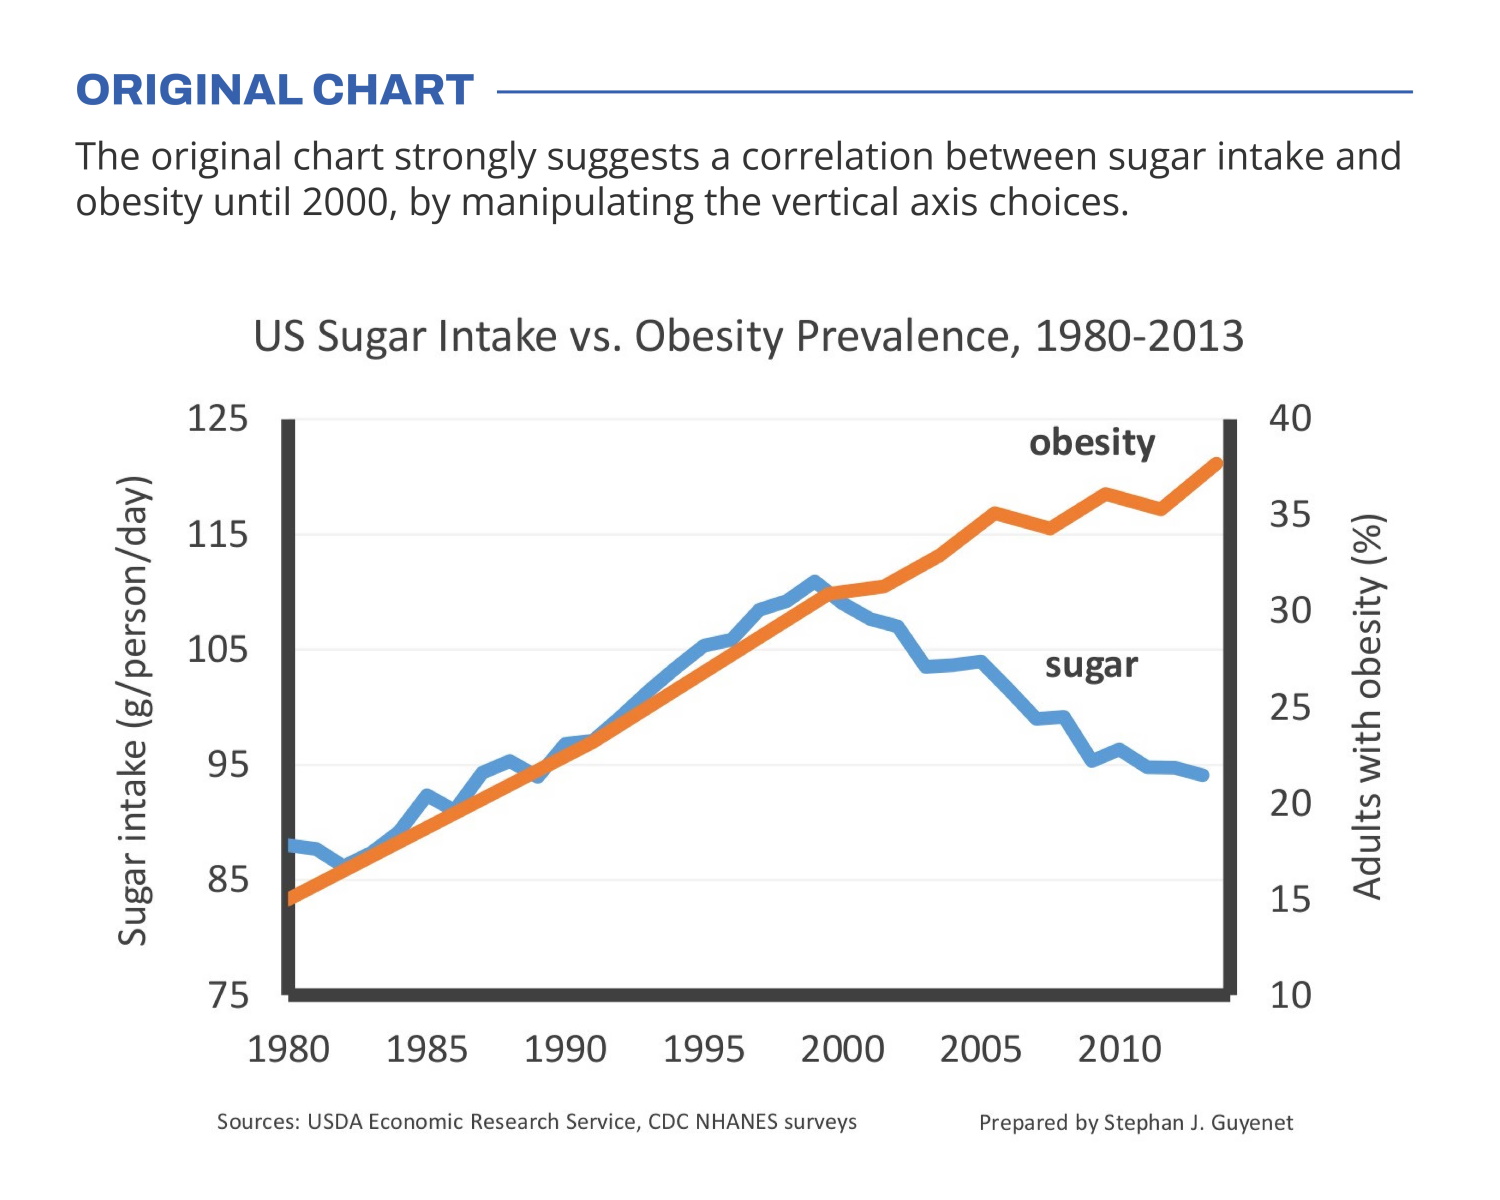
🍬 The original chart in this example is trying to suggest a strong correlation between sugar intake and obesity in the US between 1980 and 2000. It does so by carefully choosing the vertical axis ranges and scaling so both lines nicely fall on top of each other.
But with a closer look we can see something else is going on. Sugar intake levels are rising by 30% (from 85g to 110g), while obesity prevalence is rising by 164% (from 14% to 37% of the population). For an accurate comparison, these lines shouldn’t nicely align at all!
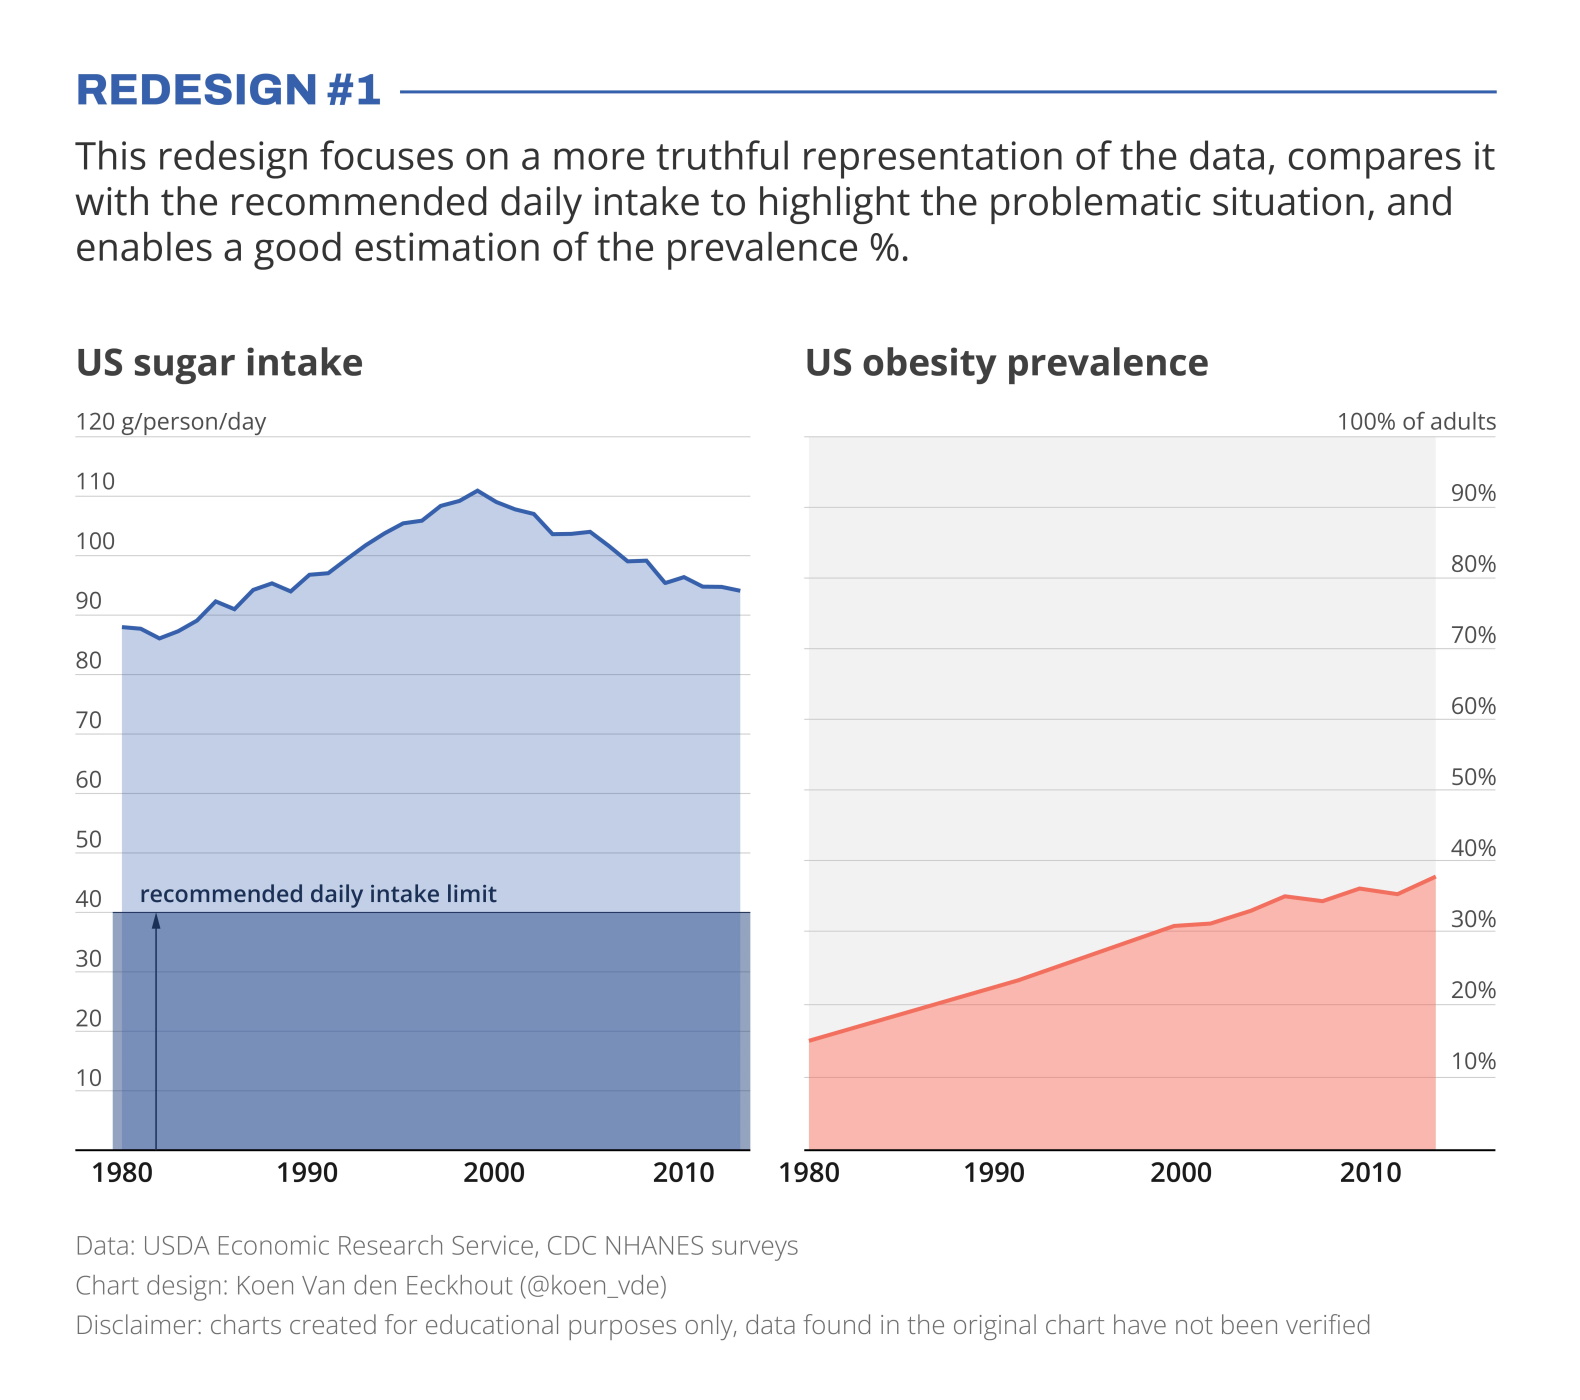
I’ve created two redesigns to present some better solutions for this visualization. In redesign 1 we focus on a presentation which is as truthful as possible, comparing the data with the recommended intake level, and enabling an accurate estimation of the prevalence %.
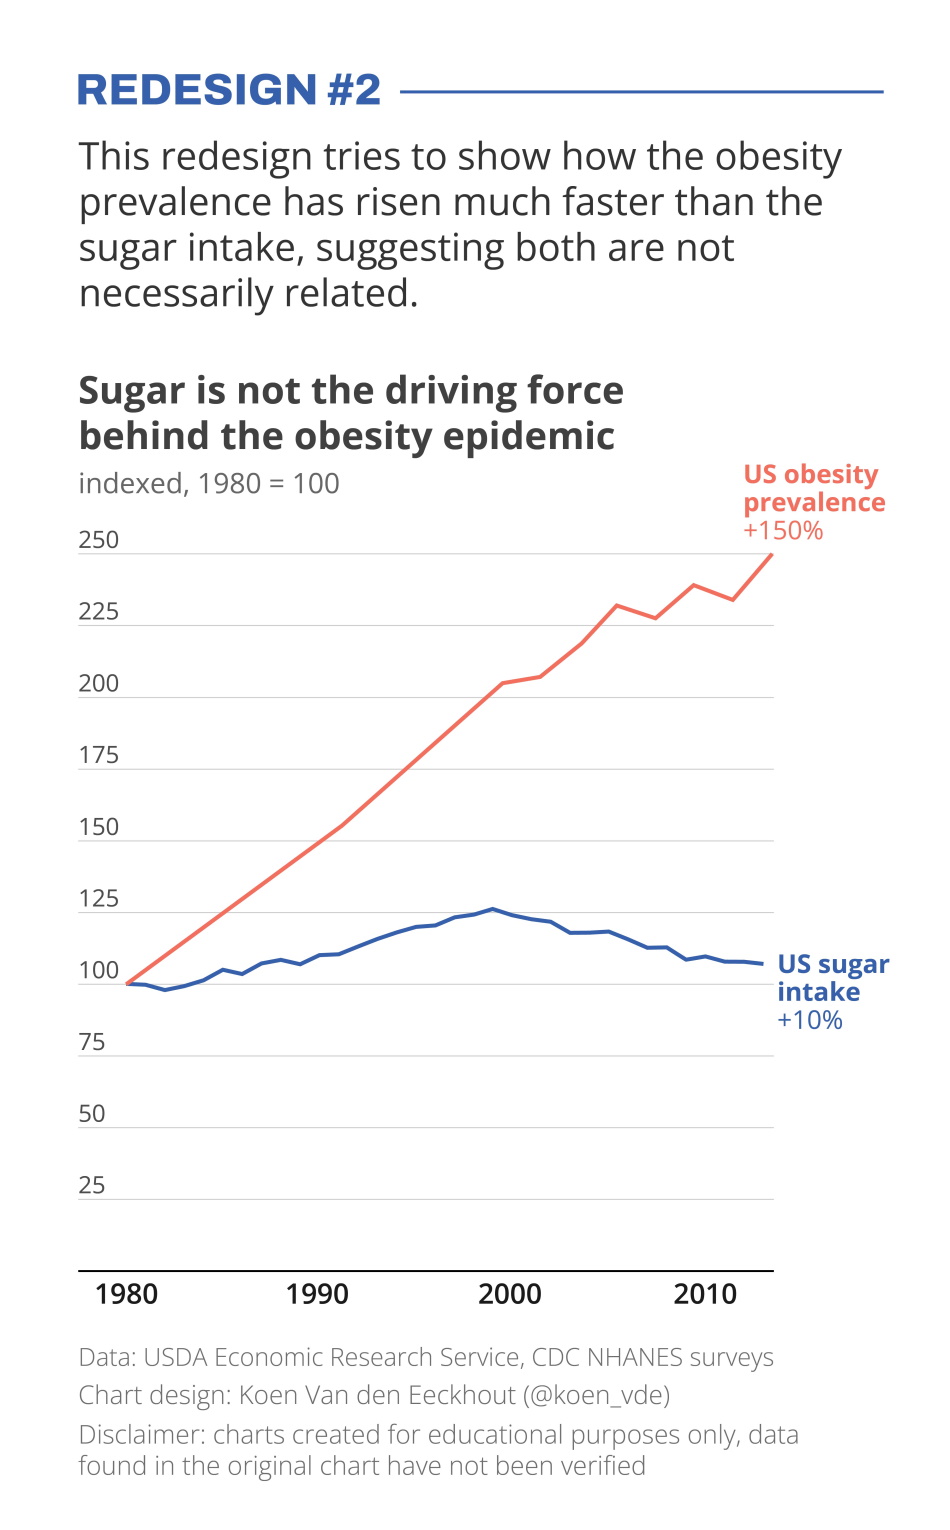
In redesign 2 we focus on showing how much faster the obesity prevalence has grown compared to the sugar intake, which has remained relatively stable.
Depending on the message you want to bring, one presentation might be preferable above the other. But in any case, manipulating your vertical axes to suggest a strong correlation which might not be there, is not very nice!
Still struggling with telling a strong visual message using truthful charts? Find out how we can help you, or reach out to us directly.
Read more:
Dear Data: Dataviz book review
Last February, on a cold and rainy day, I received the Dear Data book as part of a Dataviz Drawing workshop by Stefanie Posavec. A pretty large and heavy book, the kind you could put on your coffee table to show off (which I did!). Let's review it!
Data visualization tools: Datawrapper
If you are writing articles online and need to quickly insert beautiful, interactive charts, maps or tables, Datawrapper is the tool you are looking for.
Uncommon chart types: Waffle charts
If you thought a pie chart was the only food-related chart type out there, think again! Waffle charts are a great alternative.

We are really into visual communication!
Every now and then we send out a newsletter with latest work, handpicked inspirational infographics, must-read blog posts, upcoming dates for workshops and presentations, and links to useful tools and tips. Leave your email address here and we’ll add you to our mailing list of awesome people!