The challenge
The Circular Economy Policy Research Center has collected over 100 different key indicators related to circular economy in Flanders and Belgium, from a variety of sources. These indicators cover a wide range of topics including housing and construction, food and agriculture, consumer goods and mobility.
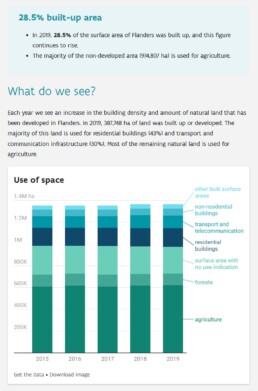
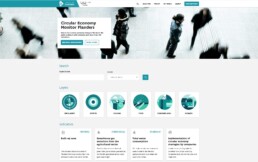
To conclude a five-year research project the Center wanted to unlock this information and make it easily accessible to the general public. They decided to build an online tool, the ‘Circular Economy Monitor Flanders’, with a heavy focus on clear data visualization.
Baryon Design was selected as a project manager to help build this monitor, and also responsible for the design and creation of the interactive charts. We worked together with Eskidoos for the UX and website development, and with ProScription for the copywriting and translation.
It quickly became apparent that this was no minor challenge: the monitor, available in both Dutch and English, would cover a total of 116 indicators in 6 topics and 22 subtopics. Experts from many different government organizations and academic institutions would be involved to provide input and the most recent data. All of this would be supplemented by analysis reports, policy background and an overview of circular economy tools.
The process
With a strict deadline in November, we had about six months to get the monitor from idea to finish. Throughout these months, we collaborated closely with the CE Center to ensure a streamlined information flow between the different partners.
The first few weeks and months were spent untangling the complexity of the project and turning it into a highly accessible user experience. All of the indicators were ordered in a logical, hierarchical structure. Throughout the site, they were represented by summary cards showing the category and key figure in the blink of an eye.
In particular, we worked hard with the UX designers to make the indicators as accessible as possible, using not only a clear hierarchical menu, but also a powerful search option and an extensive tag system – all in two languages.
We decided to use Datawrapper to create nearly 280 interactive charts in English and Dutch, because of its ability to quickly create attractive interactive charts, and their strong customer support.
The result
On November 22, 2021, Flemish ministers Demir and Crevits officially launched the CE monitor. It quickly became an example of accessible and open data communication by the government, sparking the attention of many international organizations working on the same topic. If you need insights into the status of circular economy in Flanders, the CE Monitor website is now the place to go!
Need help with your own challenging data communication project? We’re here to help! Find out what we can do for you, or simply send us a message!
Eager to turn your complex information into a powerful and attractive information graphic?