The challenge
How to design a great survey report? In 2020, the IIBA Brussels Chapter performed their first ever survey among their users. In this survey, nearly 200 Belgian business analysts shared the tools they use, the tasks they are involved in, and the level of business analysis maturity in their organization.
Even though 200 respondents answering 17 questions amounts to a relatively modest dataset, turning the results into an insightful report is quite a challenge. Which insights are most valuable for the BA community? Which are especially surprising? And how do we visualize these insights in a clear and engaging graph?
In order to answer these data visualization challenges the IIBA Brussels Chapter, together with software innovation agency Novado, enlisted the help of Baryon.

The process
Together with Filip (IIBA Brussels Chapter lead) and Saartje (driving force behind the survey) at IIBA and Ann and Nikolaas at Novado, we did several rounds of analyzing and discussing the survey results.
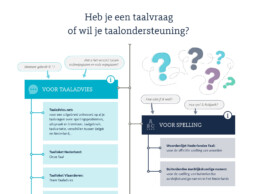
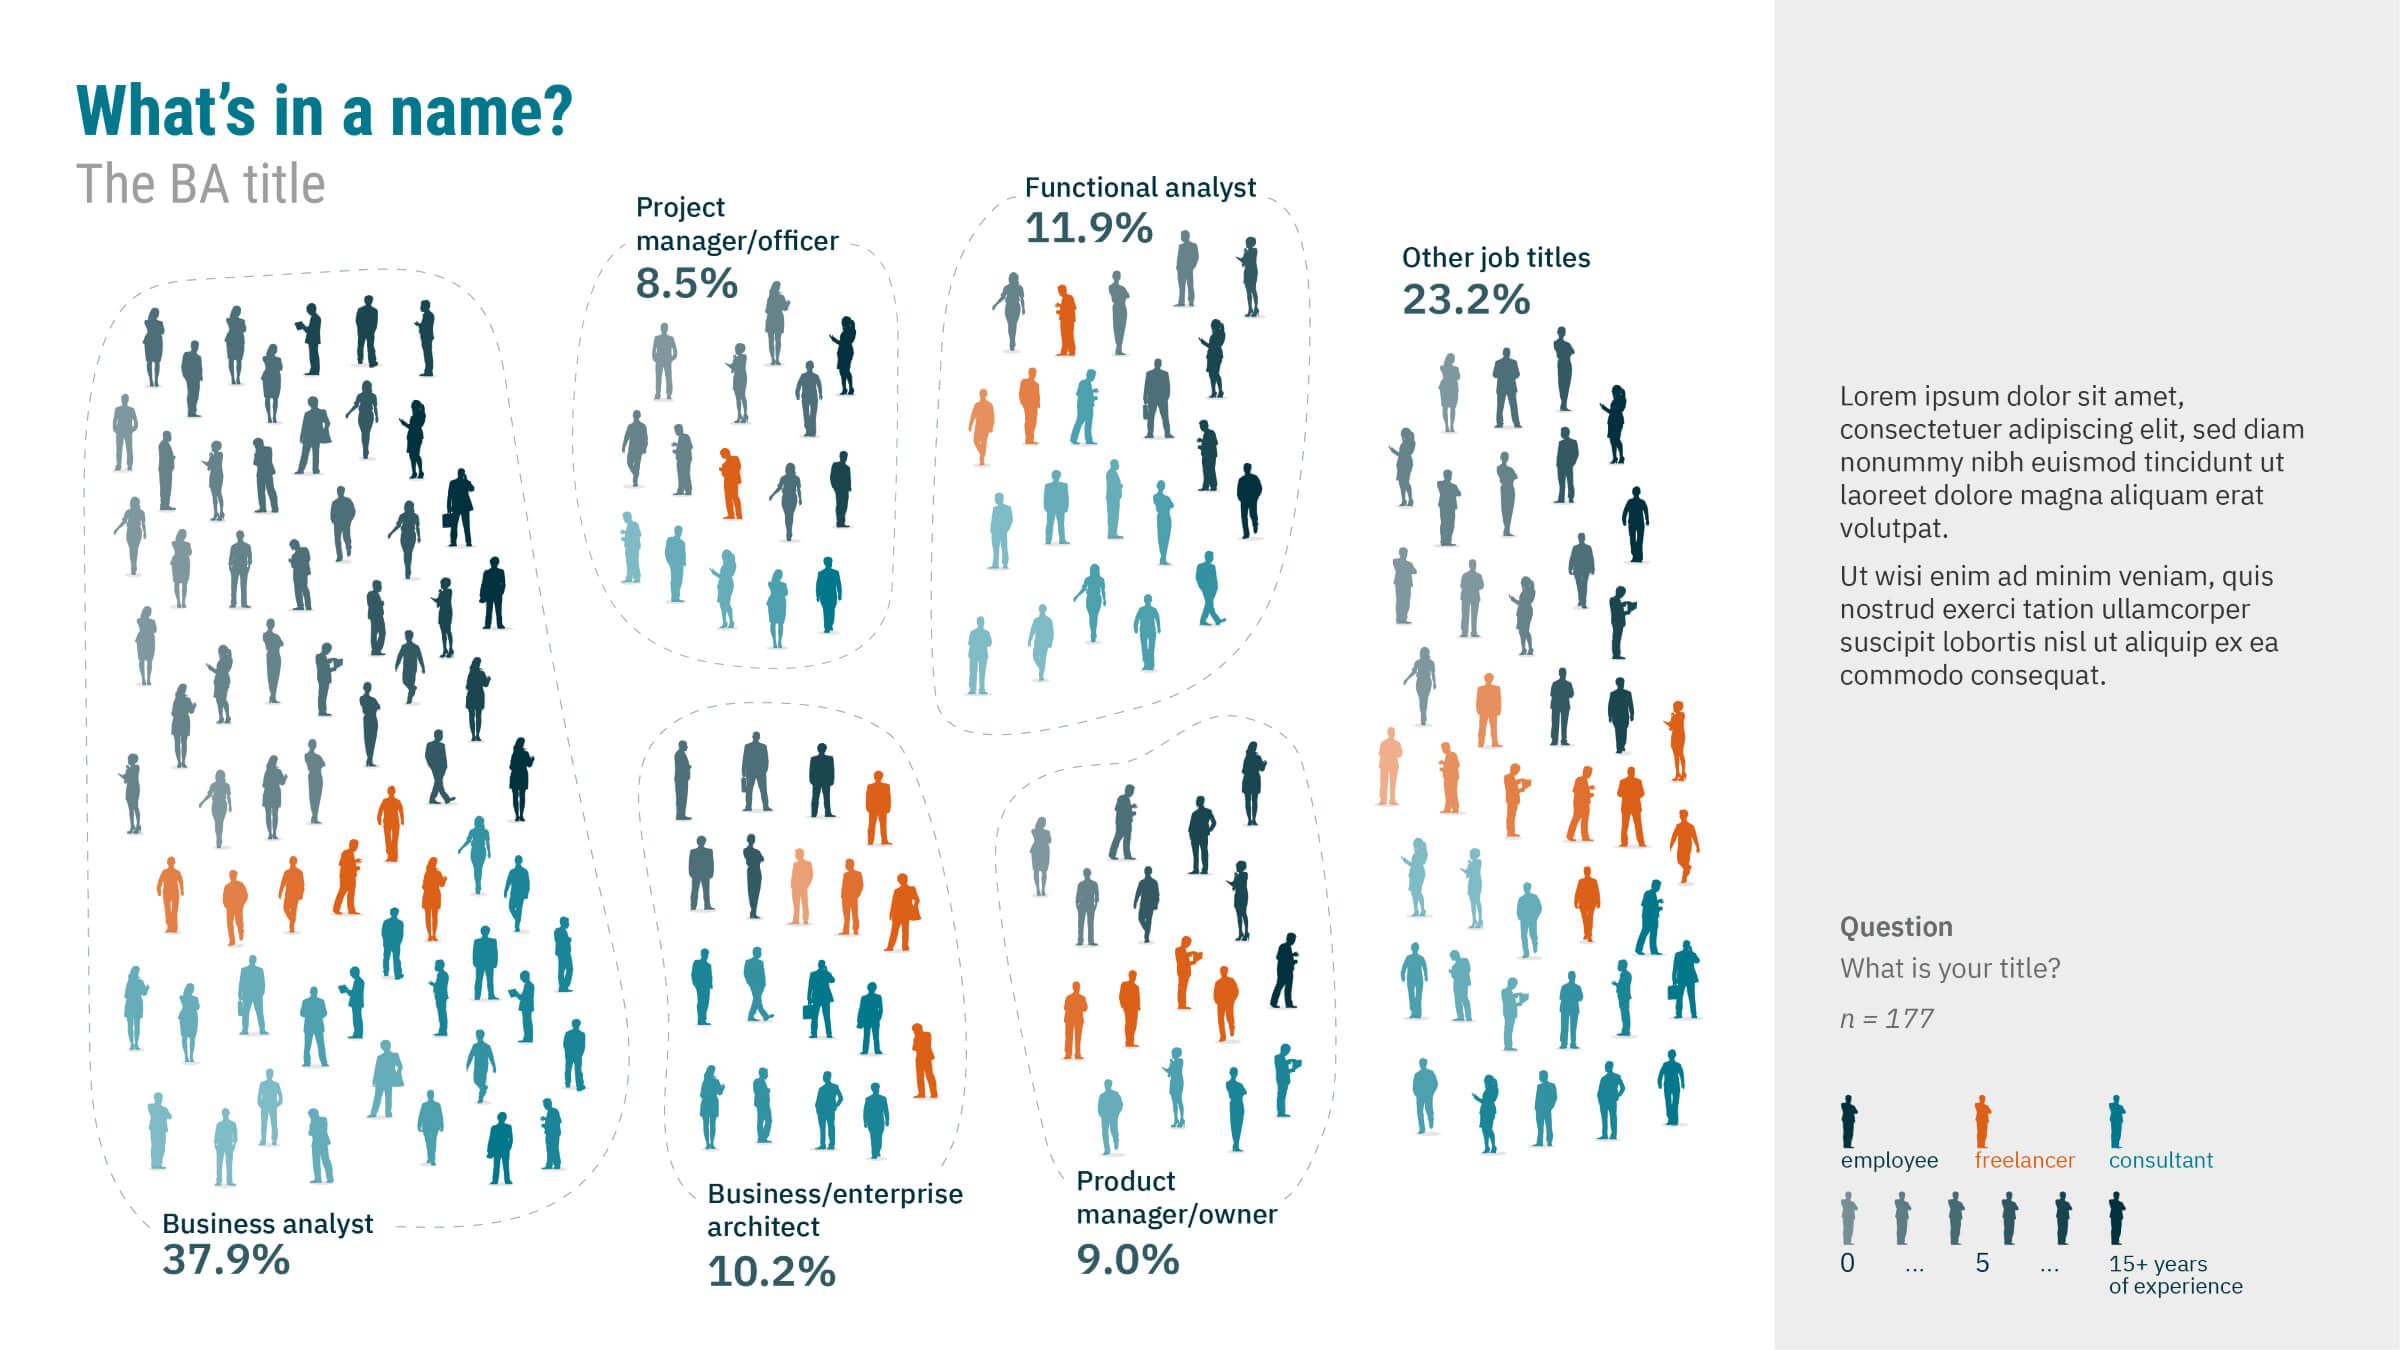
Some of the results were immediately surprising: the job title ‘Business Analyst’ is not a holy grail – in fact, most people performing business analysis as a part of their job don’t even have the word ‘Analyst’ in their job title. They’re Project Managers, Business Architects, Data Scientists, Growth Hackers,…
In order to visualize this wide variety of job titles, we opted for a very human approach. Let’s represent every respondent with their own small silhouette, group them according to their job title, and color them according to their role and level of experience:
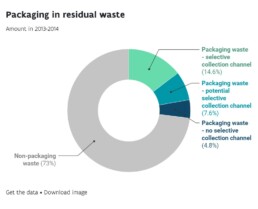
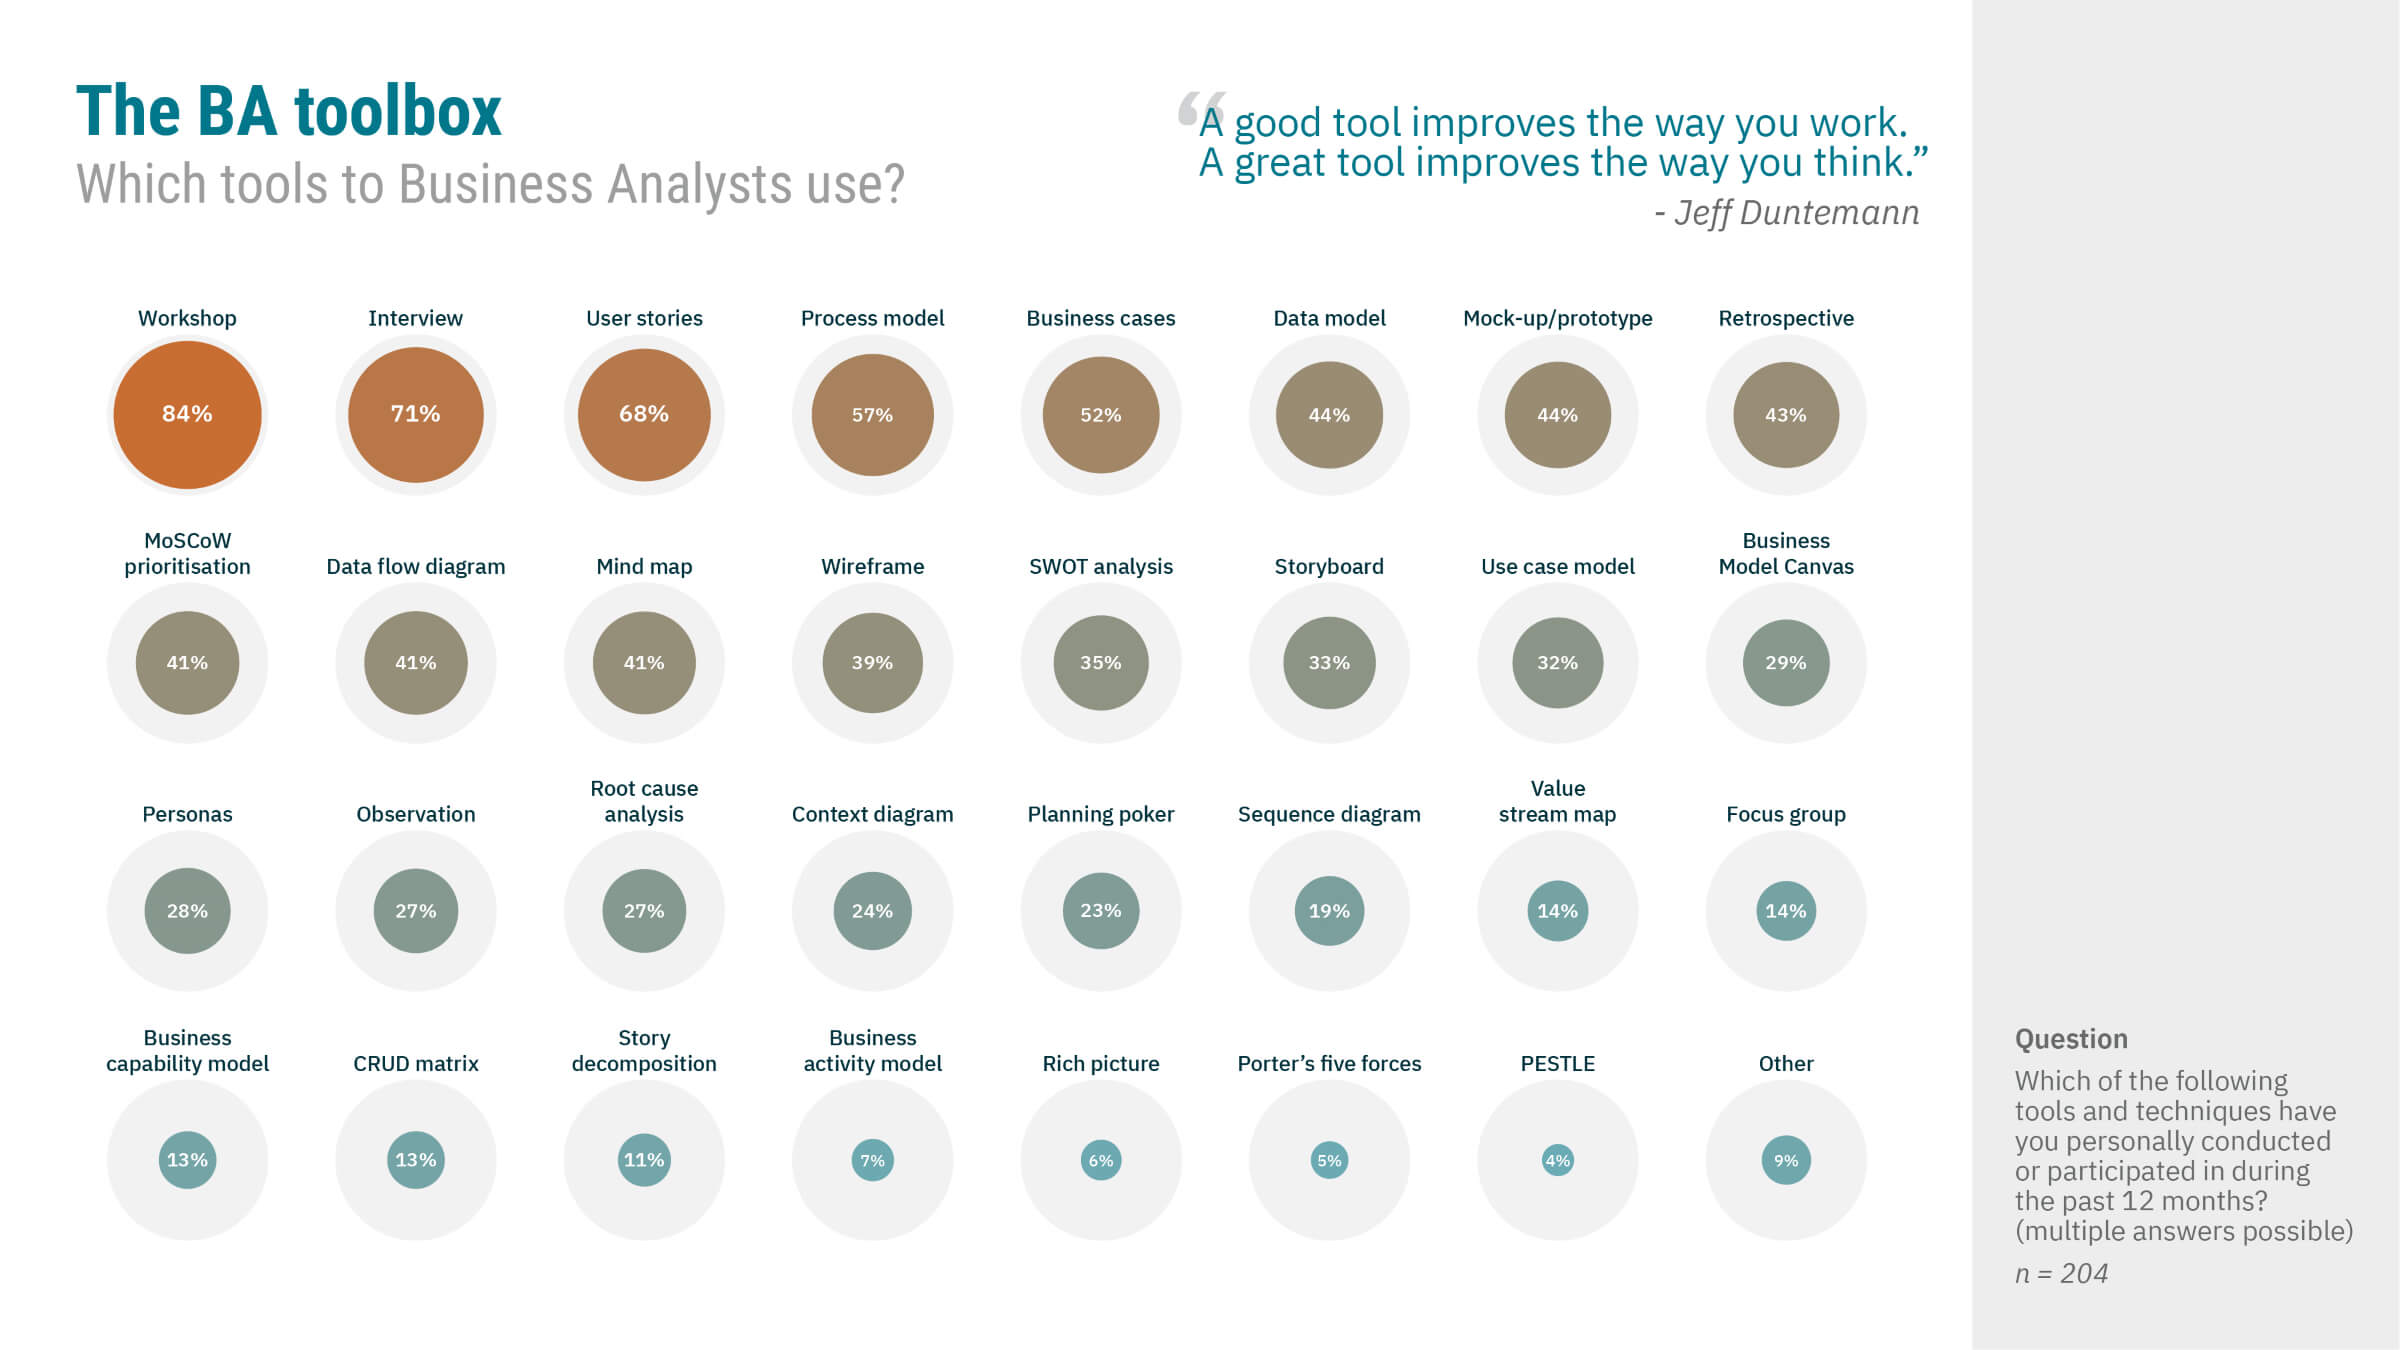
Another challenging visual shows the toolbox of Business Analysts. With over 30 different tools and methods to choose from, a classic bar chart – which would be the default choice for this kind of data – becomes impossible to read.
We decided to go for a modified pie chart approach, in which we show the prevalence of each tool using concentric circles. In this way, it is quite easy to see both the variety in tools, as well as the most and least popular tools:
The result
The first Big Belgian BA Survey was a success: it means the start of an ambitious growth for the IIBA Brussels Chapter, and helped them in being nominated as a Chapter Awards Finalist.
Most importantly, it helps in making the BA knowlegde in Belgium more broadly and openly available, so every organization can benefit from it.
Are you interested in developing your own survey, annual or sustainability report? We are specialized in information design, including the design of extensive but accessible data-driven reports. Contact us to discuss how we can help!


Eager to turn your complex information into a powerful and attractive information graphic?