Uncommon chart types: Waffle charts
If you thought a pie chart was the only food-related chart type out there, think again! There is the donut chart – basically just a pie chart with a hole in the middle – but as a Belgian, I am particularly fond of what’s called a waffle chart. It’s a great alternative to a pie chart, and very easy to make. Oh dear, my stomach’s growling already!
What is a waffle chart?
A waffle chart is basically a square display, usually consisting of 100 smaller squares arranged in a 10-by-10 layout. The squares are colored according to the proportions you are aiming to visualize, similarly to how you would color different slices of a pie chart. As this square layout somewhat resembles a delicious waffle, this immediately explains the name of the chart:
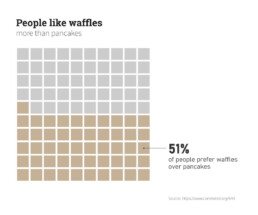
However, compared to a pie chart, a waffle chart is much easier to read – our brain is not well suited to compare different angles and slices, but we can quite easily compare different areas.
Alternative waffle charts
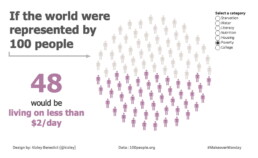
You will notice that many waffle charts are not made up of squares, but of alternative shapes, usually circles. Other shapes, such as small icons, are also possible – in this case we are approaching the realm of pictogram charts.
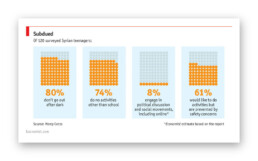
Another alternative are waffle charts consisting of more (or less) than 100 units, where the items represent actual numbers rather than fractions or percentages:
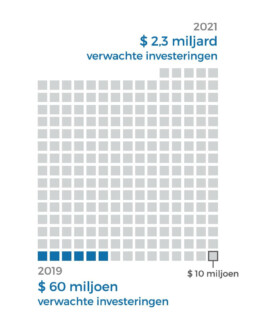
Here, each square represents $10 million, rather than 1%.
In the latter case, there are some similarities with charts we typically see after elections, showing the distribution of the different seats. One could argue that these kind of charts (‘Parliament charts’) are just a form of ‘warped’ waffle charts:
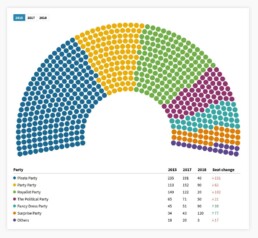
A Parliament Chart created using Flourish.
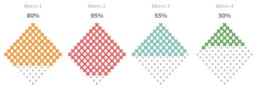
Some people prefer to turn their waffle charts by 45°, simply for design purposes, but well, some people are just weird:
Creating waffle charts
Making waffle charts is maybe a little bit tedious, but very simple! For example, you could create square cells in Excel, and color them using intelligent cell formatting to recreate the effect. If you google ‘waffle chart Excel‘ you will immediately get hundreds of blog posts and video tutorials describing the necessary steps.
Or you could take your favourite graphics software (such as Paint.NET, GIMP, or Inkscape), draw 100 identical shapes and color them according to your data.
And some people have managed to do it in Infogram, apparently.
More waffles than you'll ever need
To conclude, some wonderful things people have done with waffle charts, including this tile grid map of waffle charts about internet use in Africa:
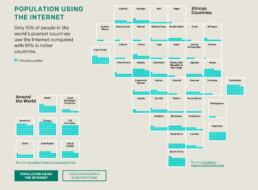
Apparently created by one.org, but I can’t find the exact source!
Oh, and a circular waffle chart is sometimes called a plum pudding chart, after J.J. Thomson’s plum pudding model for the atom, which is in turn named after a Christmas cake. The more you know!
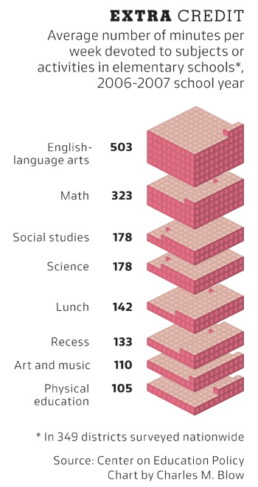
Finally, if you would ever think about creating a 3D waffle chart… it’s not impossible, but let’s say it’s frowned upon. Maybe we should keep that 3rd dimension for real waffles only?
More uncommon chart types? We have already covered:
- Slopegraphs
- Waffle charts
Read more:

Infographic: Amazing facts about the brain
Did you know that our brain makes up 2% of our body weight, but consumers about 20% of our energy? Did you know that we have a second brain, located in our gut?
Our information designer Sofia made this insightful infographic, giving you an overview of eight amazing facts about the brain!
How common is your birthday?
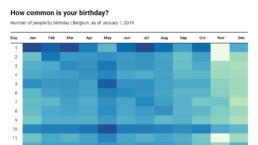
Not all birthdays are created equal... in fact, for most countries in the north temperate zone, more people are born in summer (May - August) than in winter (October - January). This heatmap allows you to check how popular your birth date is. It shows the number of people in Belgium for each specific birthday.
Visualizing Complexity: Dataviz book review
Visualizing Complexity is a great new data visualization book published by information design Superdot. Here's our verdict.

This chart is trying to trick you
The original chart in this example is trying to suggest a strong correlation between sugar intake and obesity in the US between 1980 and 2000. It does so by carefully choosing the vertical axis ranges and scaling so both lines nicely fall on top of each other.

Research visuals: all the resources you’ll ever need!
If you want to start creating clear and attractive visuals about your research, but don't know where to start, this page is for you! Here's a complete overview of tools, resources and inspiration you can use as a starting point for your designs.

Small datasets to practice your data visualization skills
When you're teaching data analysis or data visualization, or when you're learning new data visualization tools and techniques, you might be looking for datasets to practice with. Here are some great starting points.
We are really into visual communication!
Every now and then we send out a newsletter with latest work, handpicked inspirational infographics, must-read blog posts, upcoming dates for workshops and presentations, and links to useful tools and tips. Leave your email address here and we’ll add you to our mailing list of awesome people!