The challenge
The Office for Study and Career Guidance at Artevelde University College does much more than it says on the tin. They have a team of advisors and officers to assist students before, during and after their journey at the university college. They support a wide range of coaches. And they organise events, workshops, and training sessions.
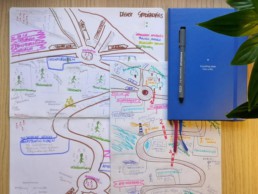
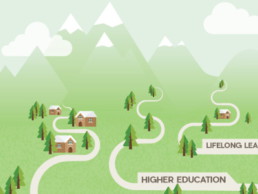
As they have to regularly communicate the scope of their activities to students and their environment, the Office was looking for an attractive way to present this information, in the form of a printable infographic. They reached out to Baryon with a rough layout for a ‘map’ or ‘trajectory’. We worked closely together to turn their vision into reality.
The process
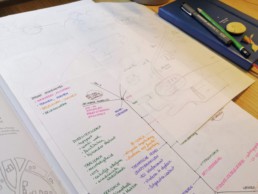
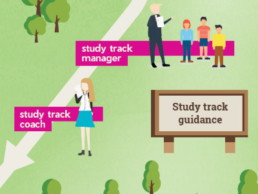
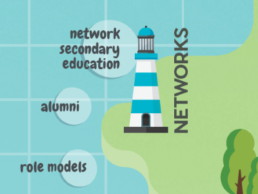
In a first step, we stripped down the information to its bare essentials: the student trajectory before, during and after their time at Artevelde. We could identify four different functions of the Office for Study and Career Guidance: inform, train, coach, and impact on policy. Furthermore, there are different external networks to which the office reaches out.
With this stripped-down version of the information in hand, we gathered styling inspiration from similar projects. We started building concepts for the structure of the infographic. How the trajectory flow would look like was defined in this crucial step.
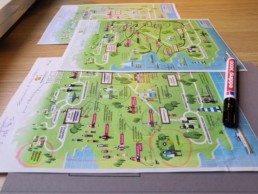
Adding color and some well-chosen illustrations to the infographic resulted in a first ‘minimum viable’ version. This version sparked a renewed discussion on the content. It was immediately clear that we were trying to convey too much information in a single visual. Also, the flow of the trajectory was not clear at first sight.
As a result of this discussion we decided together with the university college to restructure the information. The distinction between the four different functions of the office was dropped. It created confusion and was not very relevant for the student audience. Some of the illustrations were dropped as well, and arrows were added to improve readability.
In a second version, we further perfected the wording, the position of the information, and the colours. We created an English version of the infographic for use with international students.
The result
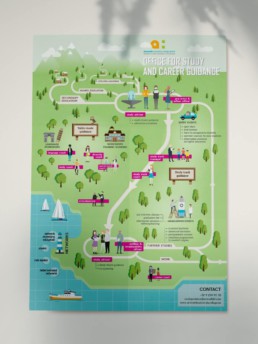
A few weeks after our initial meeting, we were proud to present the final version of the infographic to the Artevelde University College. By dropping some of the illustrations (kill your darlings!) we achieved a much lighter end result. Bright colors provide a subtle link to the corporate identity of the university college.
The infographic provides a clear, concise and attractive overview of the different tasks of the Office for Study and Career Guidance. The perfect eyecatcher to put in a brochure, or to hang on the wall. It facilitates explanations to students and their environment.
Read more about this client on the website of the Artevelde university college.
Do you want to create your own infographic with us? Find out how we can help you.
Eager to turn your complex data into powerful and attractive information graphics?