Designing reports that people actually read
Most annual reports and statistical publications end up unread. I design reports that are clear, navigable, and visually engaging — as interactive websites, as printed documents, or both.
What we can do for you:

Table design
(re)designing tables, removing noise and adding helpful elements to make tables easier to read and interact with.

Chart design
We can also develop data design guidelines as a helpful manual for designing your charts in the future.

Chart interaction / UX
integrating charts in your website or app. Can users zoom and filter, and how should the chart behave when doing so? How will charts transition between different states? What level of detail is required?

Dashboard analysis and design
(re)designing dashboards, ensuring that the right information is presented clearly at the right time. Optimizing the user experience through layout, color and typography, and interactivity choices.

Maps
creating impactful maps for print and digital, static and interactive applications.

Design guidelines
We can also develop data design guidelines as a helpful manual for designing your charts in the future.
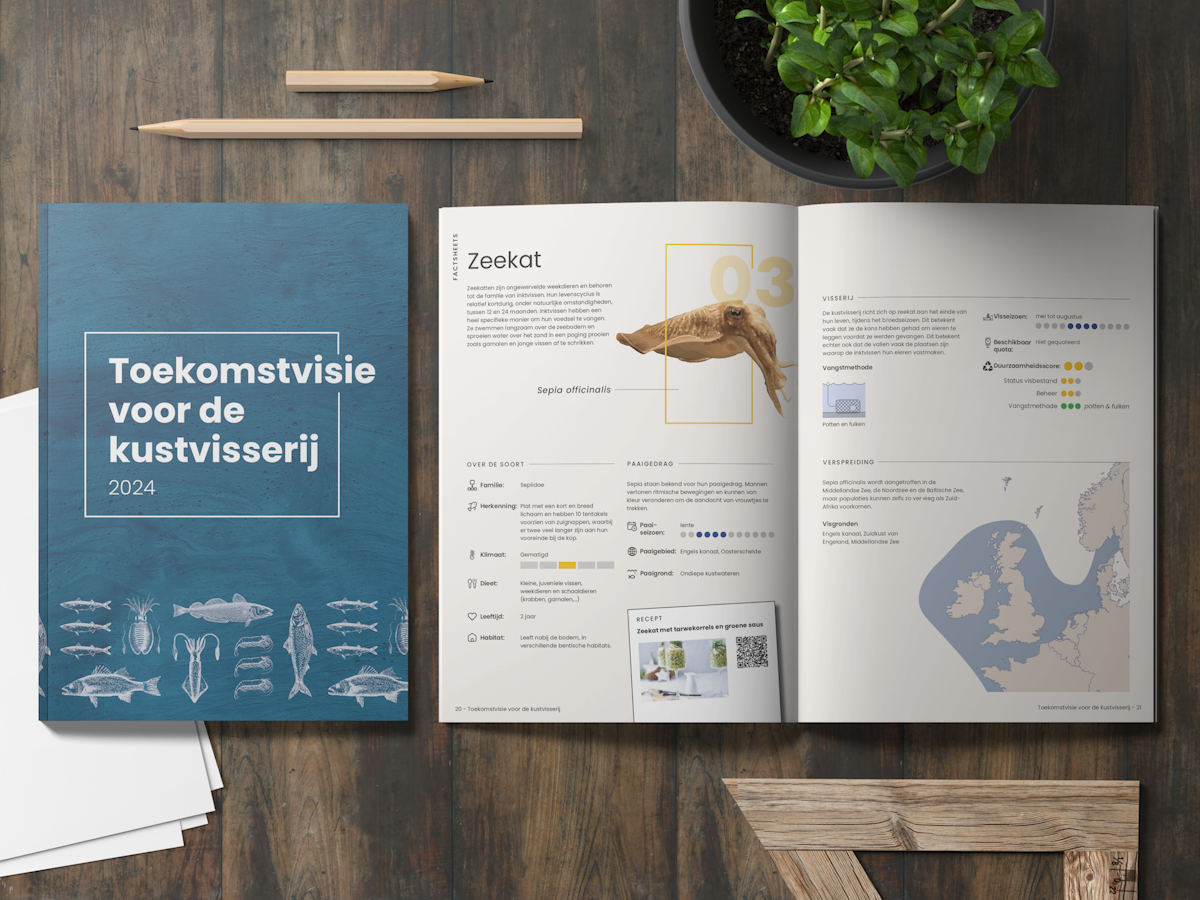
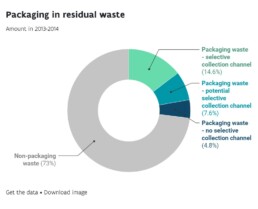
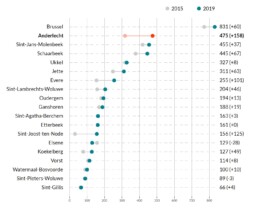
Some of our work
Let’s make your data visual!
If you’re ready to turn your own complex data into powerful visuals, don’t hesitate to contact us. We are here to help!
Or book a free 60-minute strategy session to get you on the right track.

Eager to turn your complex data into powerful and attractive information graphics?