
Making a data visual noise-free
Removing noise from a data visual is not only about taking things away such as gridlines, axes or legends. That’s just one part of it, which we could call removing physical noise. Improving the signal-to-noise ratio is often also about adding little things that help our audience better understand the visual. We are helping them by removing mental noise, or mental barriers.
Towards a noise-free data visual
This visual is a concrete example from sports science. It’s a typical chart you could encounter in a scientific article or report. It does, however, contain a lot of noise.
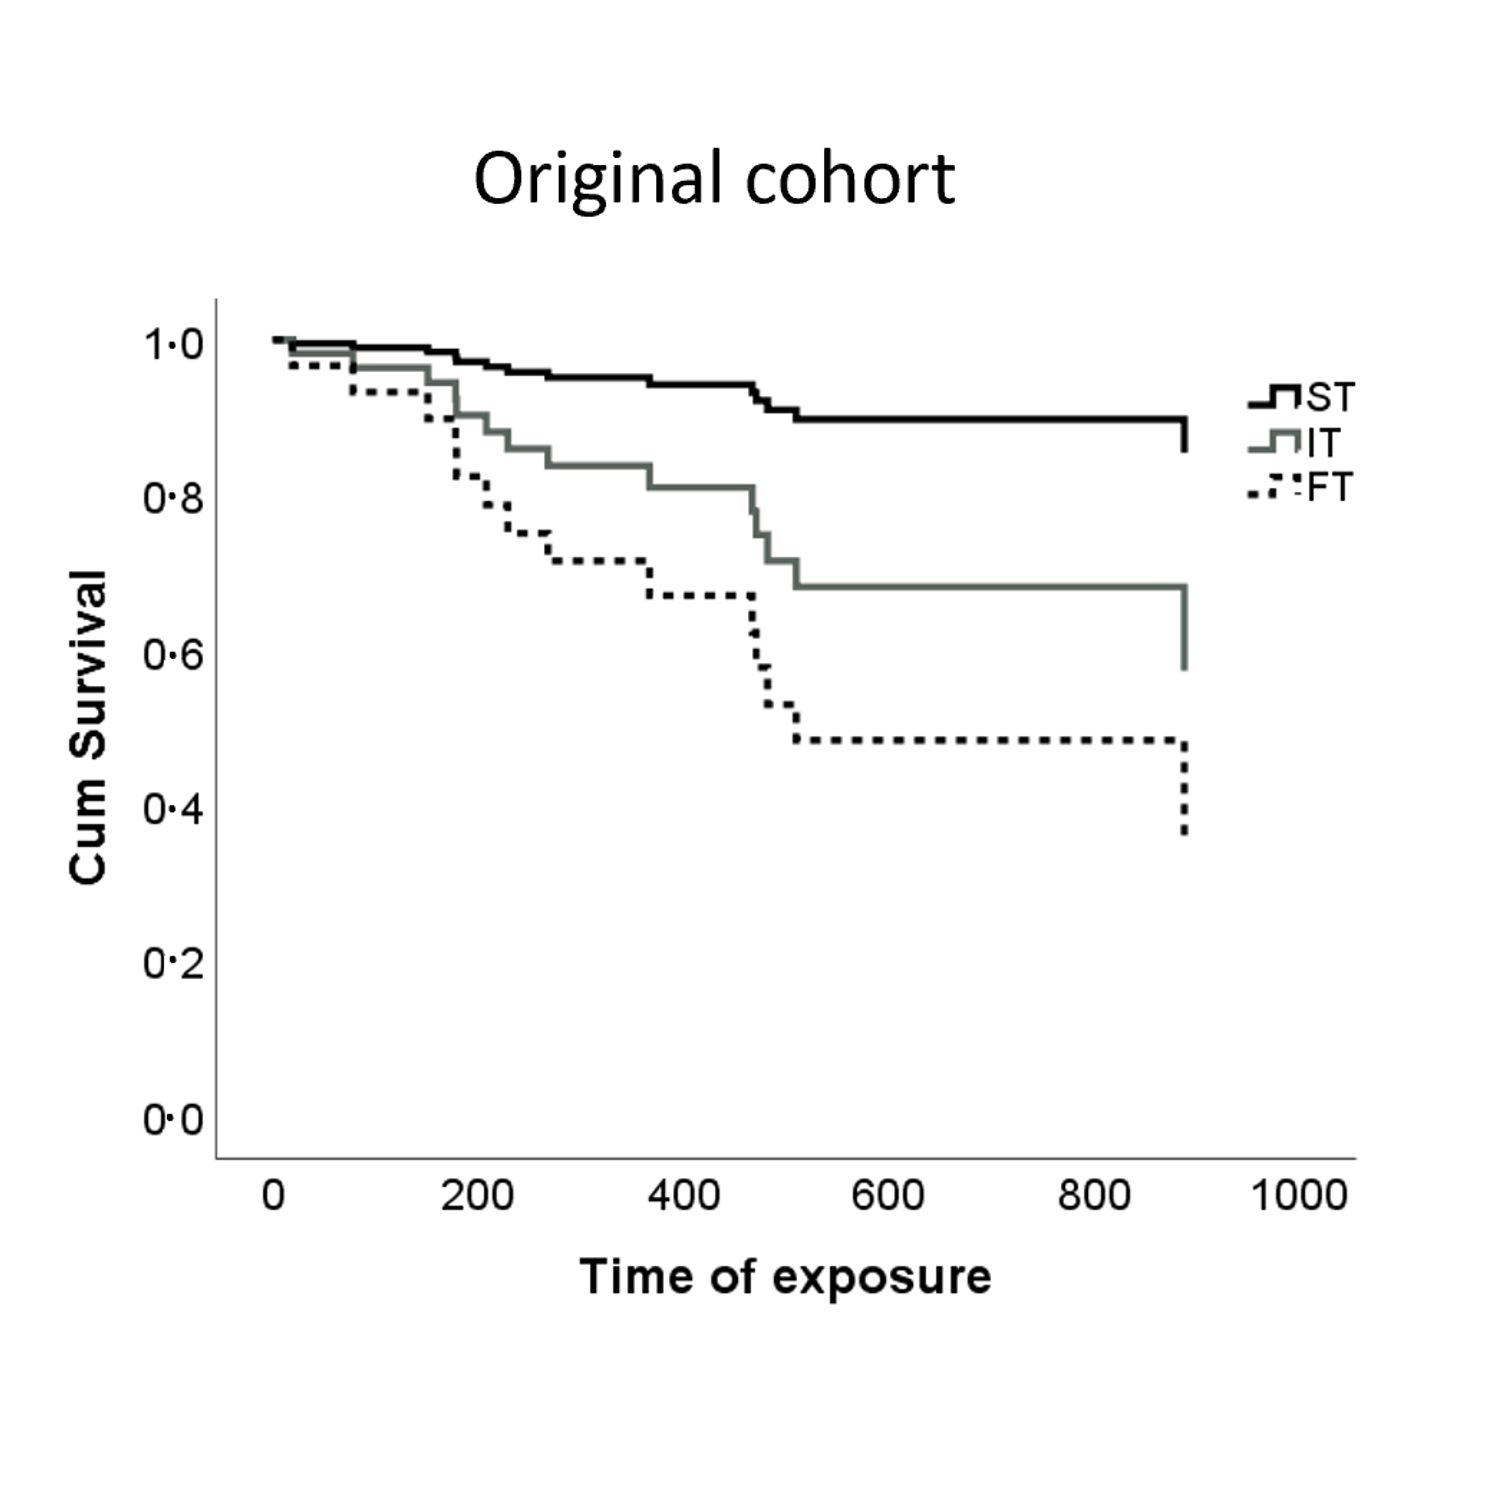
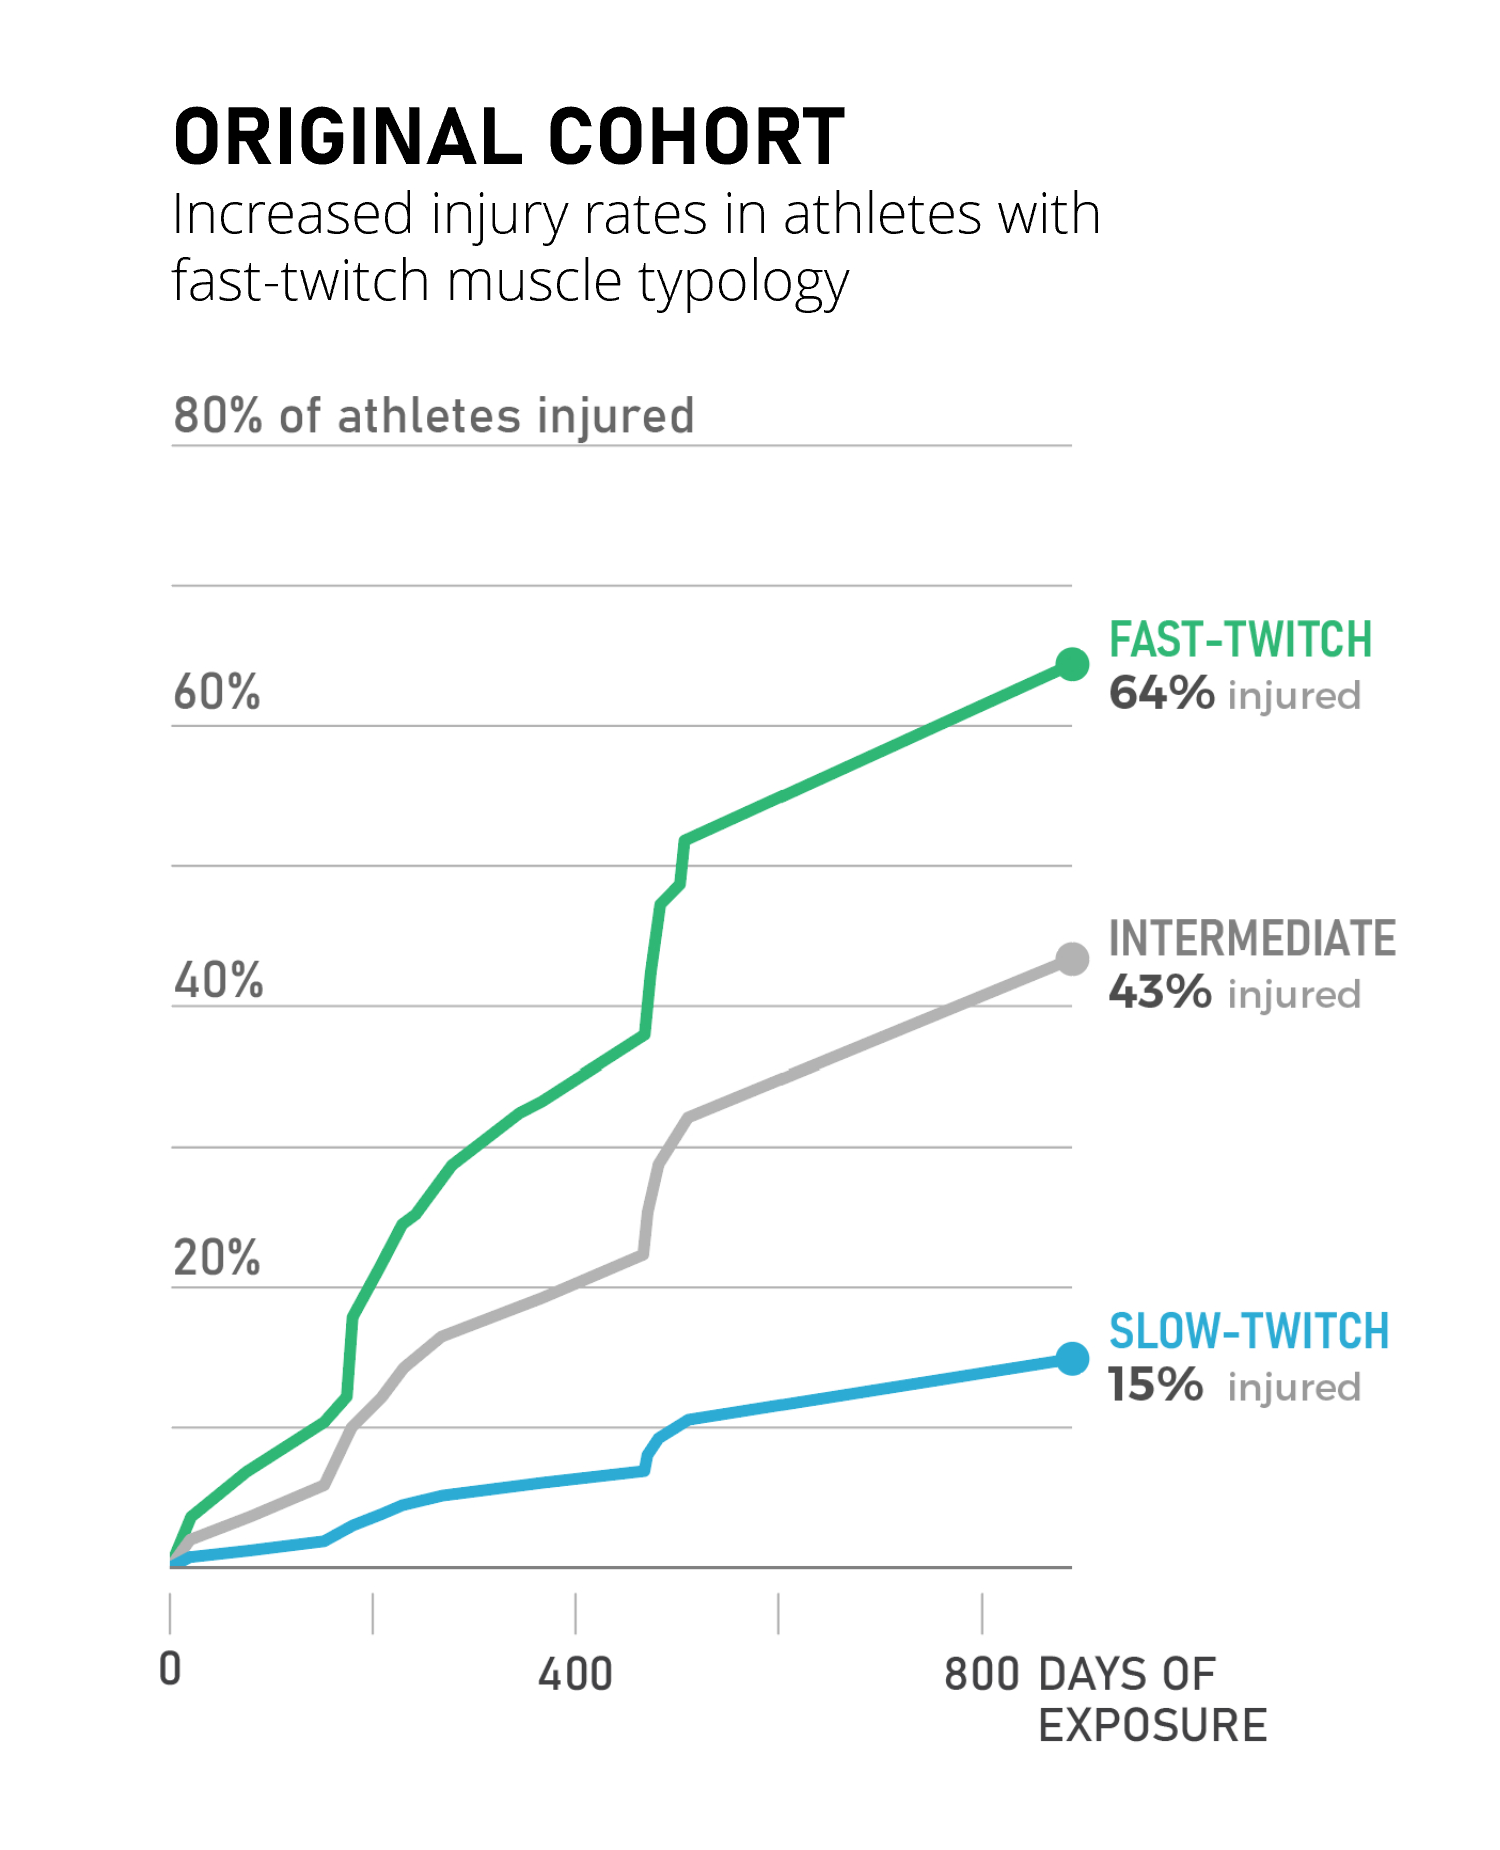
The improved visual on the right presents the same data in a much clearer way. To achieve this, we made a lot of small choices, all meant to remove mental noise and make the chart just a little bit easier to interpret.
A lot of tiny changes…
- First of all, the message is now loud and clear from the title: we see an increased injury rate in athletes with a specific muscle typology. Remember – a clear visual tells a story, it shouldn’t hide the story from our audience. ‘Original cohort’ is not a very insightful title.
- We flipped the chart around to talk about ‘injury rate’ rather than ‘cumulative survival’. The latter is a scientific term which might confuse audiences not familiar with it. Athletes are not dying, they are simply getting injured.
- Having a vertical axis makes the chart hard to read. To know the values, especially on the right-hand side of the chart, we need to take out a ruler to estimate them. The improved visual uses gridlines, making it much easier to see when lines cross a certain percentage.
- We also removed the legend and confusing abbreviations, and replaced them with direct labelling, clear colours, and explicitly showing the data values.
- Finally, in a more technical change we switched from stepwise interpolation to linear interpolation of the data points, giving us a more realistic approximation of the growing number of injuries.
…with a lot of impact
That’s a lot of tiny changes to improve the readability of the data visual. Individually, they are not very spectacular or groundbreaking. But together, they can turn a complex chart into a clean visual that’s much faster to interpret, with a much clearer message.
If you want to know more about visualizing data in the right way, you can check out the other videos in this series. Or I invite you to read my book, Powerful Charts, that will give you actionable insights and practical guidelines to create data visuals that truly engage and inspire your audience.
Full video series
- 01. Why is data visualization so powerful?
- 02. Why is data visualization so challenging?
- 03. Navigating the landscape of powerful charts
- 04. A powerful chart tells a story
- 05. A powerful chart has a high signal-to-noise ratio
- 06. Making a data visual noise-free
- 07. 7 different goals for your chart
- 08. Three roles of colour in a data visual
- 09. Choosing the right font for your data visual
- 10. Can you use Excel to create a powerful chart? (coming on January 09, 2023)

Read more:

Avoiding abbreviations
People are lazy. Make it as easy as possible for them to see what you are trying to show. There are tons of ways to reduce mental noise in your charts, but one of the easiest is avoiding abbreviations.
The uncomfortable relationship between scientific illustrations and AI
Scientific journal Nature devoted the headline of its 23 July 2026 issue to “the human art of scientific illustration in the age of artificial intelligence”. Of course, that sparked my attention.

Review: Info We Trust
Info We Trust is an ambitious, visually stunning book that sits somewhere between philosophy, information design, and a collection of visual essays.
Gridlines are better than axes
Almost always, gridlines are better than axes. Vertical axes are the default option, and they have been around for centuries, so they are very well known. But they also have downsides. My biggest problem with vertical axes is that they’re often so far away from where the action is really happening.

Review: A History of Data Visualization and Graphic Communication
Michael Friendly and Howard Wainer clearly love graphs. But A History of Data Visualization and Graphic Communication isn’t just about graphs — it’s about the stories behind them: the context, the people, the new measurements that made them necessary, and the discoveries they enabled.

Report visuals don’t have to suck
Discover how CREG, Belgium’s electricity regulator, turns complex data into clear and engaging visuals. From smart annotations to small multiples and uncommon chart types, their Monitoring Report shows how thoughtful data visualization makes technical reports easier to read and understand.
We are really into visual communication!
Every now and then we send out a newsletter with latest work, handpicked inspirational infographics, must-read blog posts, upcoming dates for workshops and presentations, and links to useful tools and tips. Leave your email address here and we’ll add you to our mailing list of awesome people!
