
Data visualization resources: all the links you'll ever need!
Data visualization: all the resources you'll ever need!
You want to start creating clear and attractive data visuals, but don’t know where to start? No worries, here’s a complete overview of tools, resources and inspiration you can use as a starting point for your designs.
Presentation
Doctoral Schools – Turning research data into powerful visuals:
- Download the slides for session 1 (pdf, 25.5 MB)
- Download the slides for session 2
- Download the slides for session 3
Finding useful datasets
- Google Dataset Search: datasetsearch.research.google.com
- Kaggle: kaggle.com
- data.world: data.world datasets
- Or read our blogpost: Small datasets to practice your data visualization skills
Inspiration for data visualization
- Information is Beautiful: informationisbeautiful.net
- Information is Beautiful awards: informationisbeautifulawards.com
- Visual.ly: visual.ly/view
- Pinterest: pinterest.com
- Dear data: dear-data.com
Digital tools to create infographics and data visuals
- Canva: canva.com
- Infogram: infogram.com
- Piktochart: piktochart.com
- Visme: visme.co
- Venngage Infographic maker and Graph maker
- Whimsical: whimsical.com
- Adobe Illustrator: adobe.com
- Affinity Designer: affinity.serif.com
- Flowchart tool: draw.io
- BioRender (like Canva, but specifically for life sciences): biorender.com
- List of dataviz tools: creativebloq.com/design-tools/data-visualization
- ggplot2 cheat sheet: https://www.maths.usyd.edu.au/u/UG/SM/STAT3022/r/current/Misc/data-visualization-2.1.pdf
Illustrations and icons
- Freepik: freepik.com
- The noun project: thenounproject.com
Colour schemes
- Adobe Color CC: color.adobe.com
- Coolors.co: coolors.co
- Pictaculous: digitalinspiration.com/color-palette-generator
- Website color schemes: canva.com/learn/website-color-schemes
- 100 brilliant color combinations: canva.com/learn/100-color-combinations
- Article: Your friendly guide to colors in data visualisation
Typography
- Dafont: dafont.com
- Google Fonts: fonts.google.com
- FontSquirrel font identifier: fontsquirrel.com/matcherator
- Font Pairing: fontpair.co
Creating graphs
- Dataviz catalogue: datavizcatalogue.com
- Choose and design the perfect chart: chart.guide
- Choosing the right chart: infogram.com/page/choose-the-right-chart-data-visualization
- The Chartmaker Directory: chartmaker.visualisingdata.com
- The Data Viz Project: datavizproject.com
- Datawrapper: datawrapper.de
- Flourish: flourish.studio
- LocalFocus: localfocus.nl
- D3.js: d3js.org
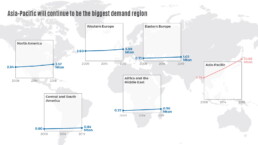
Creating maps
- Snazzy maps (Google maps styles): snazzymaps.com
- Mapbox: mapbox.com
- Mapme: mapme.com/stories
- Datawrapper: datawrapper.de
- Leaflet JavaScript Library: leafletjs.com
- 3D maps with QGIS and Aerialod: statsmapsnpix.com
- Read our blogpost: Behind the maps
Creating tables
- The Ultimate Guide to Designing Data Tables
- Table inspiration: fivethirtyeight.com
Ethics in data visualization
- Dealing with outliers: https://flowingdata.com/2018/03/07/visualizing-outliers/
- Visualizing projections and missing data: https://flowingdata.com/2018/01/30/visualizing-incomplete-and-missing-data/
- Spurious correlations: https://www.tylervigen.com/spurious-correlations
- About dynamite plots: http://biostat.mc.vanderbilt.edu/wiki/Main/DynamitePlots
- Alternatives to box plots: https://nightingaledvs.com/ive-stopped-using-box-plots-should-you/
- Visualizing the uncertainty in data (Flowing Data): https://flowingdata.com/2018/01/08/visualizing-the-uncertainty-in-data/
- Visualizing uncertainty (Claus Wilke): https://clauswilke.com/dataviz/visualizing-uncertainty.html
Books about infographics and data visualization
- Data visualisation, Andy Kirk
- Dear Data, Giorgia Lupi & Stefanie Posavec
- Information graphics, Taschen
- Infographic designers’ sketchbooks, Steven Heller & Rick Landers
- Storytelling with data, Cole Nussbaumer Knaflic
- The visual display of quantitative information, Edward Tufte
- Trees, maps and theorems, Jean-Luc Doumont
- Visual journalism, Gestalten
- Visual thinking, Willemien Brand
People on Twitter talking about data
- Twitter list: Dataviz world leaders
Videos about data visualization
- The beauty of data visualization (David McCandless)
- Journalism in the age of data (Geoff McGhee)
- Datafest Tbilisi (dozens of free talks)
- Outlier 2021 (62 free talks)
Dataviz blogs and online magazines
- Chartable (by the Datawrapper team)
- Cool Infographics (Randy Krum)
- Flowing Data (Nathan Yau)
- Infographics for the People (John Grimwade)
- The Information is Beautiful blog (David McCandless)
- Junk Charts (Kaiser Fung)
- Nightingale (by the Data Visualization Society)
- The Storytelling with Data blog (Cole Nussbaumer Knaflic)
- The Visme blog on infographics
- Visualising Data (Andy Kirk)
Dataviz podcasts
Read more:

How to create a graphical abstract
Graphical abstracts are becoming more and more important. Journal publishers such as Elsevier encourage you to create a concise visual summary of the main findings of your research. But where to start? What steps should you follow to create the perfect graphical abstract for your article? What tools can you use?

Behind the maps
In the 30-day Map Challenge, you are challenged to design a new map every day around a certain topic. I participated in November 2020, and wrote this post to share my thought processes, data sources, tools and results!

Data visualization resources: all the links you’ll ever need!
You want to start creating clear and attractive data visuals, but don't know where to start? No worries, here's a complete overview of tools, resources and inspiration you can use as a starting point for your designs.
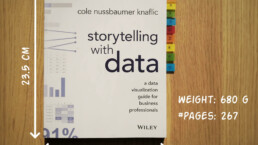
Storytelling with Data: Dataviz book review
The Storytelling with Data book has been on my wishlist as long as I can remember, because so many people recommend it as one of the must read dataviz books. So let's see what the fuzz is all about - here's my review!
Uncommon chart types: Slopegraphs
Slopegraphs appear in 'serious' newspapers, but they are very easy to create yourself. Use them if you want to compare how values have changed between two different points in time!
Data visualization in a time of pandemic – #6: Viral scrollytelling
In this final chapter, we’ll dive deeper into some of the insightful stories which have been published about the novel coronavirus and the COVID-19 pandemic. Rather than looking at single charts, we’ll highlight some long-form stories about the origin of the virus, how it works, and how it spread.
We are really into visual communication!
Every now and then we send out a newsletter with latest work, handpicked inspirational infographics, must-read blog posts, upcoming dates for workshops and presentations, and links to useful tools and tips. Leave your email address here and we’ll add you to our mailing list of awesome people!

